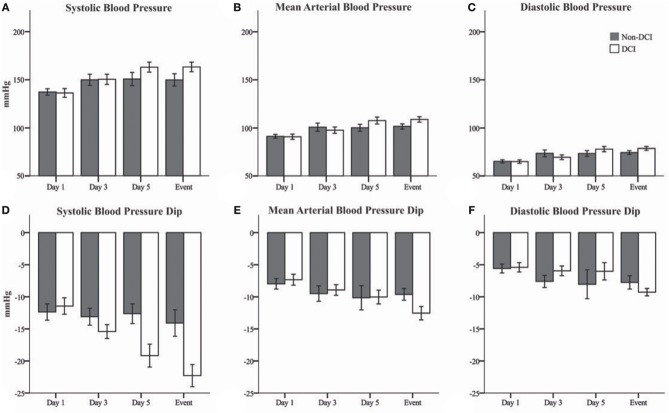
Figure 1.
Bar graphs showing systemic blood pressure at t0 and maximal blood pressure changes after Nimodipine administration in patients with evolving delayed cerebral ischemia (DCI, white) and patients without DCI (Non-DCI, gray). (A) Systolic (SBP), (B) mean arterial (MAP), and (C) diastolic (DBP) blood pressures at time of Nimodipine administration (t0). (D) SBP, (E) MAP, and (F) DBP changes after Nimodipine administration. Event = day preceding DCI or day 10 in patients without DCI. Mean ± Standard error of the mean.

