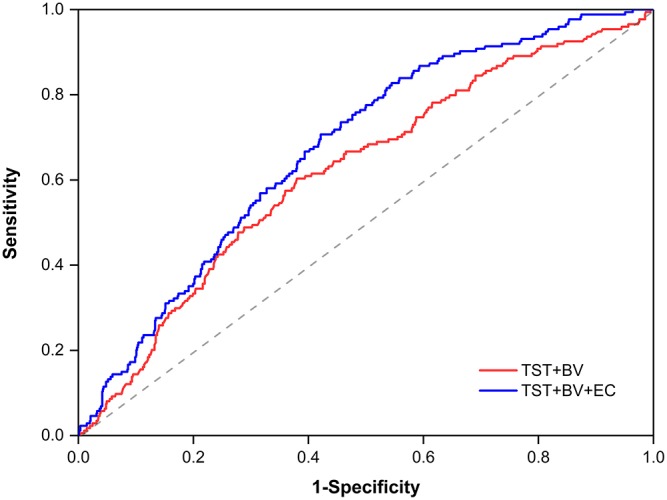
Figure 1.

Receiver operating characteristic curves by using a growth definition of >33%, with a binary logistic regression model incorporating BV, TST, and EC (AUC = 0.675) or BV and TTS only (AUC = 0.620). BV, baseline hematoma volume; TST, time from symptom onset to initial computed tomography; EC, eosinophil count; AUC, area under the receiver operating characteristic curve.
