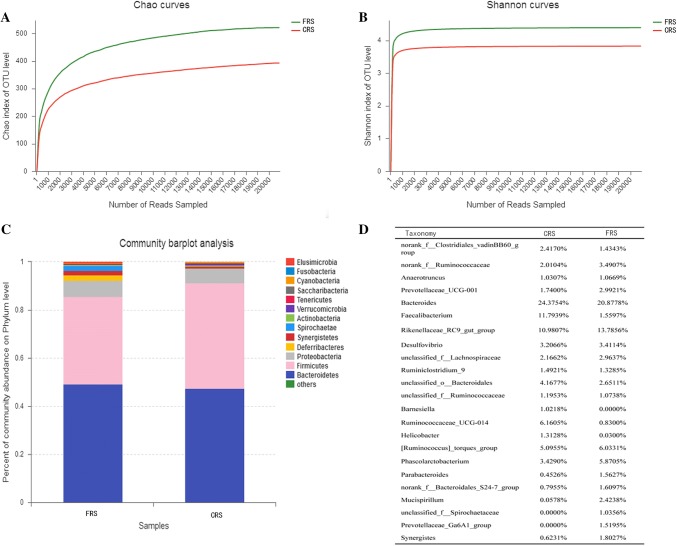
Fig. 1.
16S rRNA profiling of gut microbes from hens rearing under CRS and FRS. a Average rarefaction curve of the Chao diversity index; b average rarefaction curve of the Shannon diversity index; and, c average taxonomic composition of phyla. The legend shows the average of relative abundance of each gene in all samples

