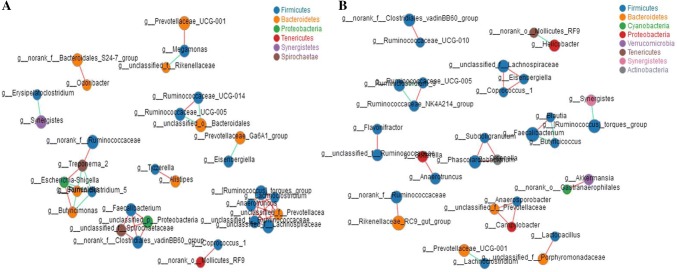
Fig. 3.
Network analysis of cecal microbes in hens reared under FRS and CRS. Network correlation of the 50 most abundant species in a FRS and b CRS. Node size indicates relative abundance of a species; different colors indicate different species; red line indicates positive correlation and green indicates negative correlation; line thickness indicates magnitude of the Pearson correlation coefficient, where thickness increases with magnitude

