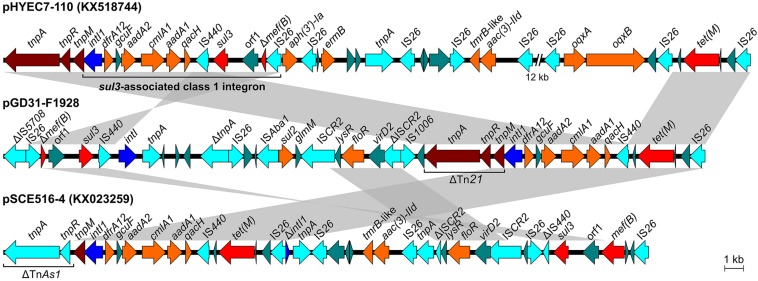
FIGURE 4.
Structural comparison of regions harboring class 1 integron and sul3 element of pGD31-F1928 and E. coli plasmid pSCE516-4 with sul3-associated class 1 integron of E. coli plasmid pHYEC7-110. Boxed arrows indicate the positions of open reading frames and their directions of transcription. Gray-shaded areas denote more than 99% DNA identity between sequences.

