
Figure 6.
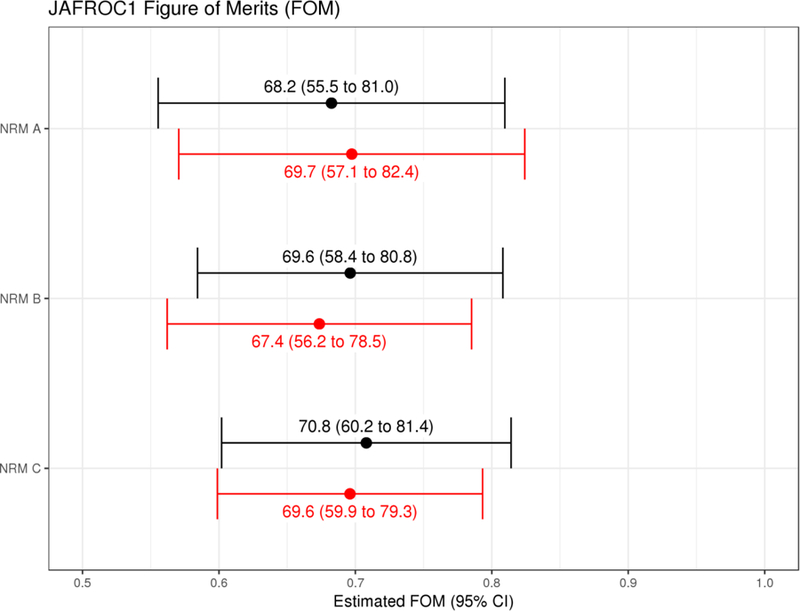
Comparison of the pseudo-reader result (bottom, red) vs. the fully crossed study (top, black) for a study that utilized noise reduction method D to pair readers based on performance for the mock study. The results of the estimates that utilized 5 pseudo-readers (400 reading interpretations) are compared to those obtained using the fully cross results utilizing all 10 years (800 reading interpretations). For the pseudo-reader estimate, a single estimate from the pseudo-reader was drawn at random from the pool of 2000 bootstrapped estimates.