Figure 2.
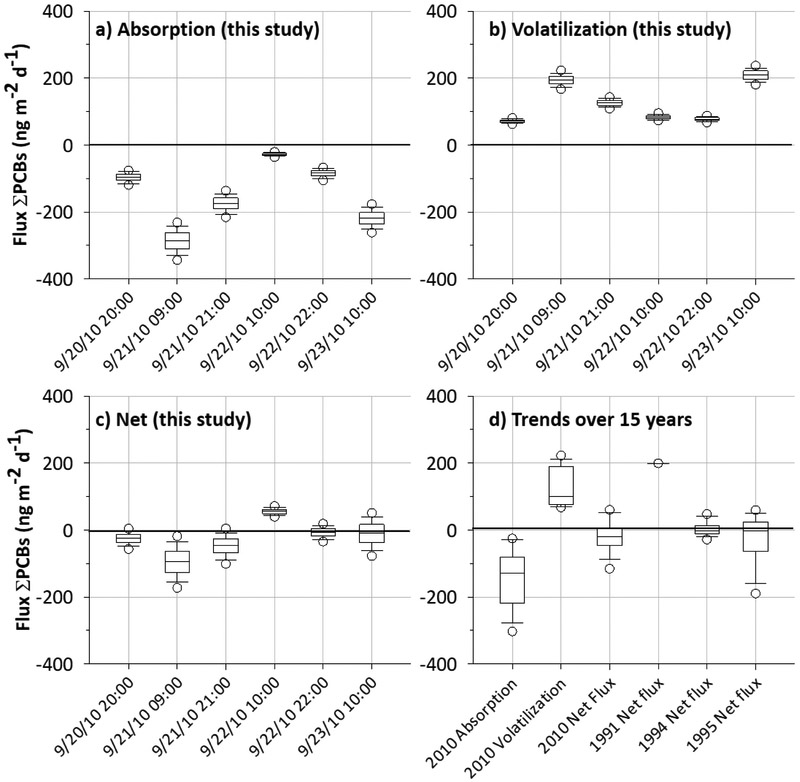
Absorption (a), volatilization (b) and net fluxes (c) of ΣPCBs for the six sampling periods (this study). Values were computed from the Monte Carlo simulations (n = 1000). Box plots describe from top to bottom the 95th percentile, 75th percentile, median, 25th percentile and 5th percentile values. The x-axes indicate the air starting sampling time. Plot (d) summarizes the absorption, volatilization and net fluxes for the six sampling periods (this study), including other net fluxes from 1991 to 1995. Net fluxes from 1991 (n = 1) are from Hornbuckle et al. (1995); 1994 (n = 22) and 1995 (n = 12) from Miller and Hornbuckle (2010) and Zhang et al. (1999), respectively.

