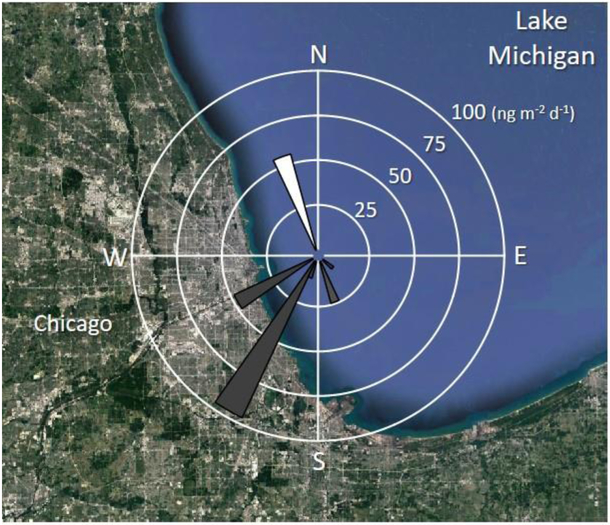
Figure 3.
Wind flux rose plot for the six net fluxes estimated in ng m−2 d−1. Grey triangles correspond to net absorption, while white triangle corresponds to net volatilization. Flux values are the median of each estimated net flux (Figure 2c). The average of wind direction during the air sampling period was used as the wind direction (Table S3).

