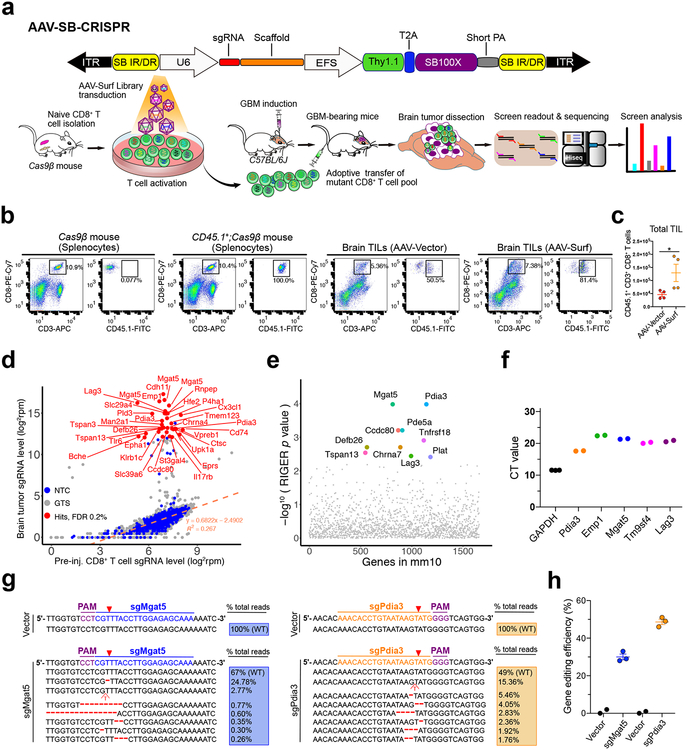
Figure 1. In vivo AAV-CRISPR CD8+ T cell screen of membrane bound proteome knockouts in GBM.
(a) (Top) Schematics of the hybrid AAV-SB-CRIPSR vector;
(Bottom) Schematics of in vivo AAV-SB-CRIPSR screen in a syngeneic mouse model of GBM. Schematics of naïve CD8+ T cell isolation, AAV library transduction, GBM cell transplantation, adoptive cell transfer (ACT), organs isolation, sgRNA readout and deep sequencing. 5 × 10⁵ GL261 cancer cells were injected in to the brain, and 3 × 10⁶ Cas9β CD8+ T cells were intravenously injected after 10 days of tumor engraftment. Brain tumors were dissected at the endpoint of survival.
(b) Flow cytometry analysis of TILs in the GBM bearing brain. 5e5 GL261-FLuc cancer cells were injected per mouse, at day 12 after tumor injection, luciferase imaging was performed to reasonably group mice based on luminescence intensity, then 4e6 CD45.1+;Cas9β CD8+ T cells were i.v. injected. Mice were euthanized at day 6 after T cell injection, brains (without olfactory and hindbrain) were dissected for TIL isolation. The i.v. injected CD45.1+;CD3+;CD8+ T cells were quantified and sorted for TCR-seq. Cas9β mouse and CD45.1+;Cas9β mouse splenocytes were used as gating controls. Data was collected from one experiment.
(c) Quantification of TIL number after transduction with AAV-Vector and AAV-Surf virus. Data was collected from two mice per group, two independent stainings were performed for each mouse. Data shown are mean ± s.e.m.. * p < 0.05, Mann Whitney test, two-tailed.
(d) Bulk analysis for brain tumor vs. cell sgRNA library representation of an AAV-Surf GBM CD8+ T cell screen experiment. A list of most significantly enriched sgRNAs in brain tumors are highlighted as red dots (FDR <= 0.2%). Custom methods by comparing sgRNAs to NTCs were used to estimate enriched sgRNAs (one-sided). FDR was calculated based on the ranks of sgRNAs relative to NTCs.
(e) RIGER analysis for brain tumor vs. cell gene level significance of AAV-Surf screen experiment, taken the metrics from multiple sgRNAs. The top 10 most enriched genes (by RIGER p-value, second-best sgRNA method) in brain tumors are highlighted.
(f) CD8+ T cell mRNA levels of several top hits from the AAV-Surf GBM screen. The mRNA levels of all candidates were measured with RT-qPCR using gene-specific probes, indicating that all genes tested are expressed in mouse primary CD8+ T cells. (n = 3 for Gapdh, n = 2 for other genes).
(g-h) Nextera indel analysis for Mgat5 and Pdia3 knock-out in mouse CD8+ T cells. (g) Representative mutations were shown around predicted sgRNA target sites. (h) Quantification of total indel frequency for each gene were shown, demonstrating that AAV-mediated primary mouse CD8+ T cell gene editing was efficient. (n = 2 for Vector group, n = 3 for sgMgat5 and sgPdia3 groups). Data are shown as mean ± s.e.m.., plus individual data points on the bar graph.

