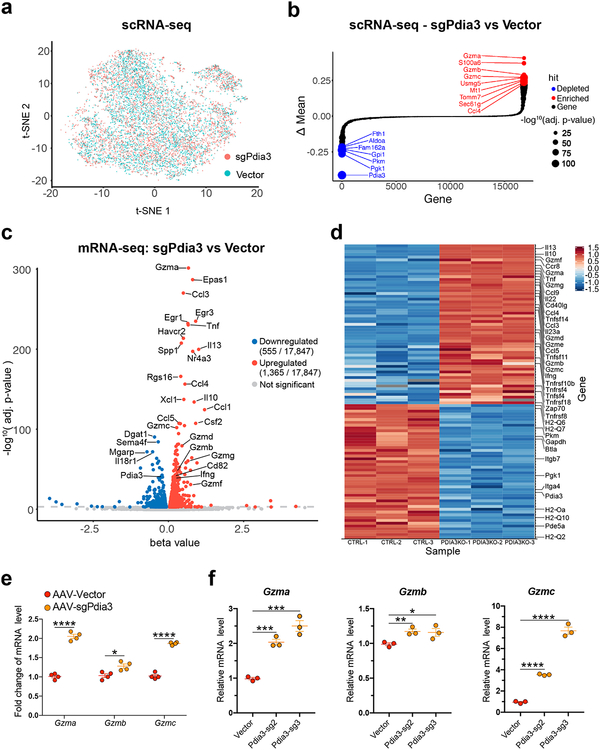
Figure 3. Single-cell RNA-seq and bulk mRNA-seq analysis of Pdia3 knockout in CD8+ T cells.
(a) t-SNE plot of sample distribution based on the transcriptome of 9,193 single cells from AAV-sgPdia3 and AAV-Vector treated CD8+ T cells.
(b) Bubble-rank plot of differential gene expression of scRNA-seq. Delta-mean is the difference of mean expression value between AAV-sgPdia3 and AAV-Vector treated single CD8+ T cells (n = 3 each group). Differential expression: Two-sided Wilcoxon signed-rank test by gene, with p-values adjusted by Benjamini & Hochberg. Statistical significance is scaled by –log10, p-value as shown in the size key.
(c) A volcano plot of all differentially expressed genes between AAV-Vector and AAV-sgPdia3 transduced mouse primary CD8+ T cells (n = 3 biological replicates). Differential gene expression was performed with Sleuth using Wald test, the FDR adjusted q-value was used for the plot.
(d) Heatmap of representative immune-related differentially expressed genes between AAV-Vector and AAV-sgPdia3 transduced mouse primary CD8+ T cells (n = 3 biological replicates).
(e) RT-qPCR validation of the scRNA-seq and bulk mRNA-seq results confirmed the upregulation of granzyme genes upon AAV-sgPdia3 perturbation (n = 4). Unpaired t test, two-tailed. * p < 0.05, **** p < 0.0001.
(f) RT-qPCR validation of scRNA-seq and bulk mRNA-seq results using two independent Pdia3 sgRNAs (n =3). Unpaired t test, two-tailed. * p < 0.05, ** p < 0.01, *** p < 0.001, **** p < 0.0001.
The p-values and number of mice used in each group are indicated in the plots and/or in a supplemental excel table.

