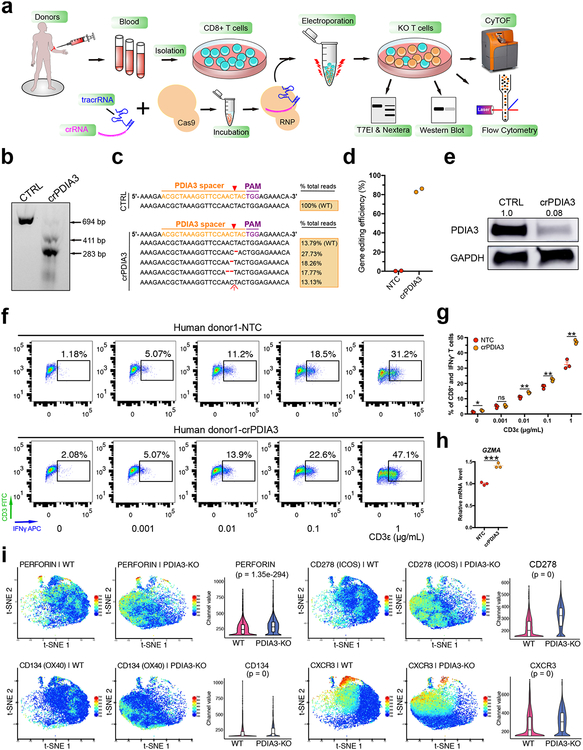
Figure 5. Human CD8+ T cells PDIA3 knockout and effector function analysis.
(a) Schematics of human CD8+ T cell isolation, culture, RNP electroporation, T7EI assay, Nextera sequencing, Flow cytometry and CyTOF analysis.
(b) T7EI assay showed human PDIA3 knockout with a high efficiency compared with control. Arrows pointed to pre- and post- cleavage products of predicted sizes. Data shown are representative of three independent experiments.
(c) Nextera data quantification of gene editing efficiency of (b).
(d) Quantification of Nextera data (n = 2 each).
(e) Western blot for PDIA3 change in protein level upon CRISPR knockout. Data from one experiment.
(f) IFNγ intracellular staining after PDIA3 KO.
(g) Quantification of (f). Two-sided multiple t test was used to assess the significance. Holm-Sidak method was used for multiple comparisons correction. * p < 0.05, ** p < 0.01, ns, not significant. The p-values and number of mice used in each group are indicated in the plots and/or in a supplemental excel table.
(h) qPCR validation of GZMA expression. Unpaired t test, two-tailed. *** p < 0.001.
(i) t-SNE plots of representative markers detected by the CyTOF. Perforin, two co-stimulatory molecules (CD134/OX40 and CD278/ICOS) and CXCR3 were found to be significantly upregulated at the single cell level upon PDIA3 KO (n = 3 replicates each, sampled 7,000 cells per replicate for comparison). Violin plots were used for visualizing marker levels quantitatively in single cells. Violins show kernel probability density on side, and boxplot is standard, i.e. middle band is median, hinges/ends of box are interquartile range (25% and 75% quantiles), lower whisker = smallest observation greater than or equal to lower hinge - 1.5 * IQR, upper whisker = largest observation less than or equal to upper hinge + 1.5 * IQR. Wilcoxon test, two-sided, p value adjusted by Benjamini & Hochberg method. KO vs WT, PERFORIN, p = 1.35e-294; CD278, p = 0 (below algorithm detection limit); CD134, p = 0; CXCR3, p = 0.

