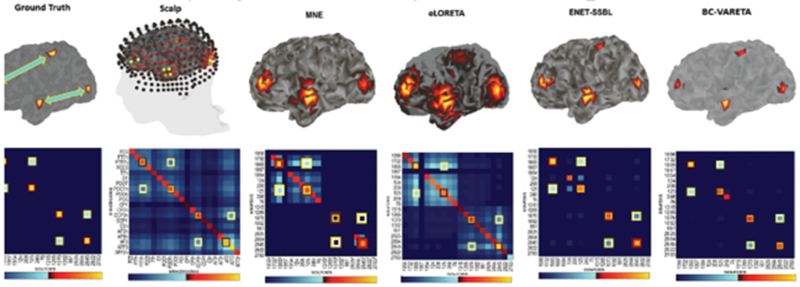
Figure 4.

A computer simulation example to illustrate sensor and source connectivity issues. Four dipoles were placed upon the cortical surface. The forward field was generated by a BEM forward model. Activation is coded by a heat scale (red to yellow) and connectivity by a cool scale (blue to white). The projection to the scalp produces a very blurred activation and connectivity matrix due to volume conduction. On the right these same quantities are shown for four example inverse solutions - MNE, e-Loreta, ENET-SSBL, and BC-VARETA showing the appearance of “leakage” of both activation and connectivity estimates.
