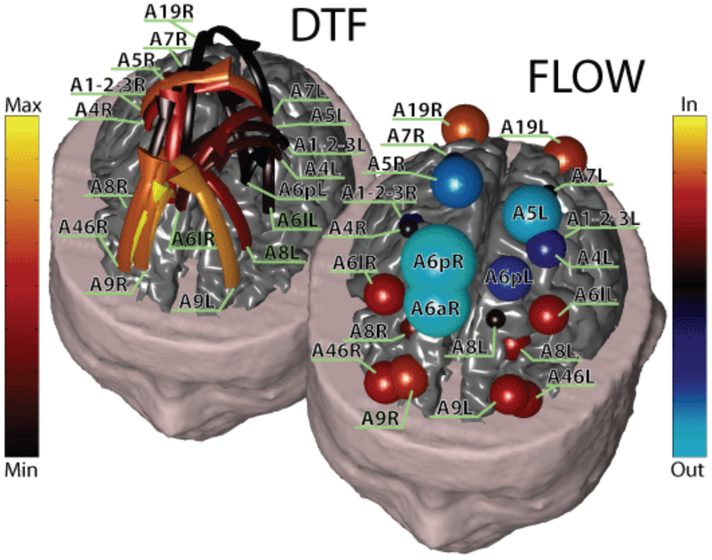
Fig. 5.

Top left: Functional connectivity patterns estimated in a subject during the performance of finger tapping movement, after the EMG onset. Each pattern is represented with arrows moving from one cortical area toward another. The color and size of the arrows code the level of strength of the functional connectivity observed between ROIs. The labels indicate the names of the ROIs employed. Bottom right: outflow patterns in all the ROIs obtained for the same connectivity pattern depicted in top left. The figure summarizes in red hues the behavior of a ROI in terms of reception of information flow from other ROIs, by adding all the value of the links arriving on the particular ROI from all the others. The information is represented with the size and the color of a sphere, centered on the particular ROI analyzed. The larger the sphere, the higher the value of inflow or outflow for any given ROI. The blue hues codes the outflow of information from a single ROI towards all the others. (From [134])
