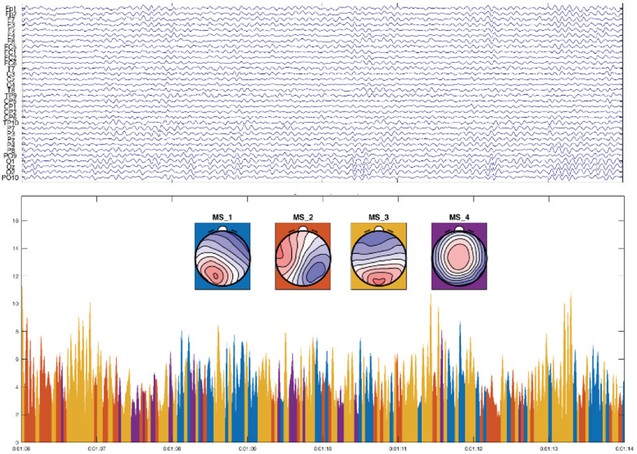
Fig. 6.

Example of a spontaneous 8 sec EEG epoch and the decomposition of the data into microstates. The Upper part shows the bandpass (2-20Hz) filtered EEG. In the lower part, we see the four microstate classes estimated in the individual subject and the GFP of the above EEG data, color labelled based on the assignment of the individual time points to the best-fitting microstate class.
