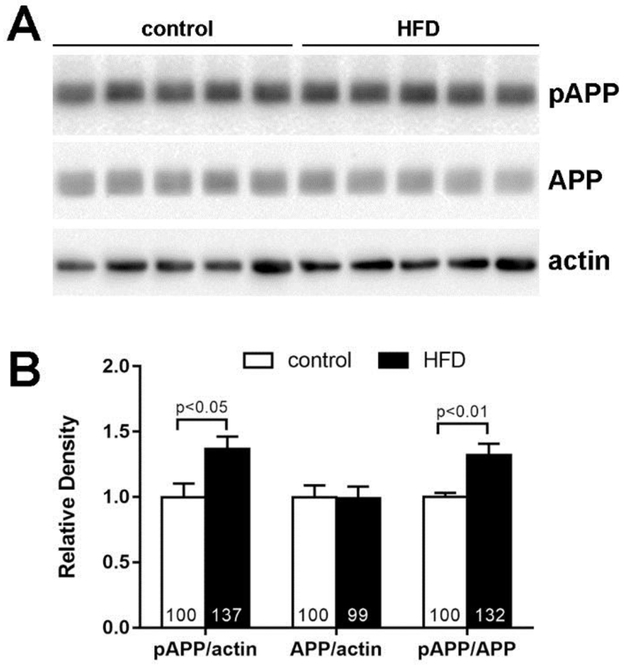
Figure 4. APP phosphorylation is increased in HFD mouse cortex.
(A) Cortex homogenates from 24 wk control (n=5) and high fat diet (HFD; n=5) mice were analyzed by the Western immunoblotting. Each lane represents a cortex from one animal. (B) The relative density determined by densitometric analysis. The % change is indicated in the bars. Results are shown as mean ± SEM and analyzed by Student t-test.

