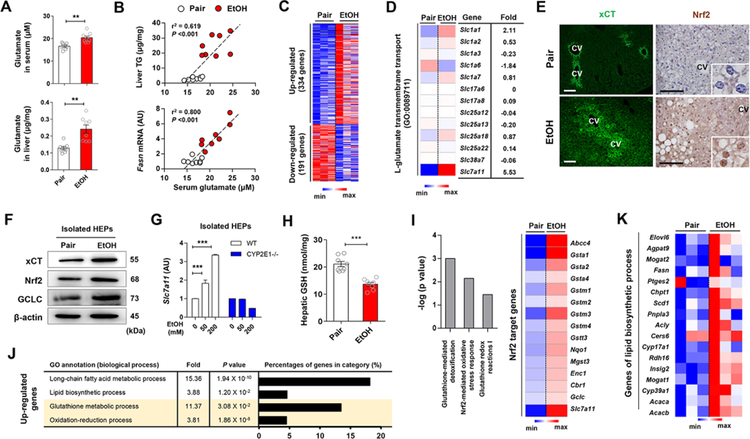
Figure 1. Alcohol-induced increase in hepatic xCT expression and glutamate levels coordinate the upregulated gene expression of antioxidant response and lipid biosynthesis.
(A) Glutamate concentrations in serum and liver of WT mice fed with ethanol (EtOH) liquid diet or an isocaloric diet (pair) for 8 weeks (n = 8/group).
(B) Correlation of serum glutamate with liver TG or Fasn mRNA levels. Correlations were assessed by linear regression analyses (n = 8/group).
(C and D) RNA-sequencing analysis of the liver from WT mice (n = 3/group). Heatmaps show differentially expressed 525 genes (C), of which Slc7a11 mRNA was most increased (D).
(E) Representative immunofluorescent staining of xCT and Nrf2 in liver sections of WT mice. Central vein (CV).
(F) Representative Western blot analysis of xCT, Nrf2 and GCLC protein expression in isolated hepatocytes (HEPs) of WT mice.
(G) Slc7a11 mRNA expression in HEPs isolated from WT and CYP2E1 KO mice and exposed to EtOH for 24 h (3 replicates).
(H) Glutathione (GSH) concentration in liver tissues of WT mice (n = 8/group).
(I-K) RNA-sequencing analysis of the liver from WT mice (n = 3/group). Ingenuity pathway analysis of canonical pathways of the livers and heatmap representation of genes controlled by Nrf2 (I). The enriched 4 gene ontology (GO) terms (by upregulated genes), fold enrichment, FDR adjusted P value and the percentage of genes in each term (J). Heatmaps showing differentially expressed genes related with lipid biosynthetic processes (K).
Data are presented as mean ± SEM. **P < 0.01, ***P < 0.001. Scale bars, 50 μm.
See also Figure S1.

