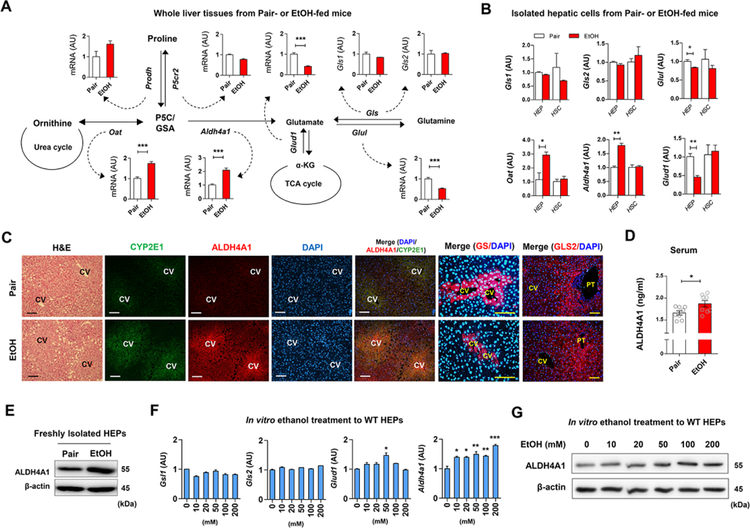
Figure 2. Increased ALDH4A1 and CYP2E1 expression in livers of liquid ethanol diet-fed mice.
(A) Graphical representation of glutamate synthesis pathways and hepatic mRNA expressions in pair-fed or EtOH-fed WT mice for 8 weeks (n = 8/group). Values represent the results from three experimental replicates.
(B) Relative mRNA expression of Gls1, G/s2, Glul, Oat, Aldh4a1, and Glud1 in freshly isolated HEPs and HSCs from WT mice (n = 4/group). Values represent the results from three experimental replicates.
(C) Representative H&E staining and immunofluorescent staining of CYP2E1, ALDH4A1, GS, and GLS2 of liver sections. Central vein (CV) and portal triad (PT)
(D) Serum ALDH4A1 levels (n = 8/group).
(E) Representative Western blot analysis of ALDH4A1 protein expression in isolated HEPs from pair-fed and EtOH-fed mouse liver.
(F) Hepatic expression of mRNAs in freshly isolated WT HEPs after 24 hour-ethanol treatment//? vitro. Values represent the results from three experimental replicates.
(G) Representative Western blot analysis of ALDH4A1 protein expression in ethanol-treated WT HEPs for 24 h. Values represent the results from two experimental replicates.
Data are presented as mean ± SEM. *P < 0.05, **P < 0.01, ***P < 0.001. Scale bars, 50 μm.

