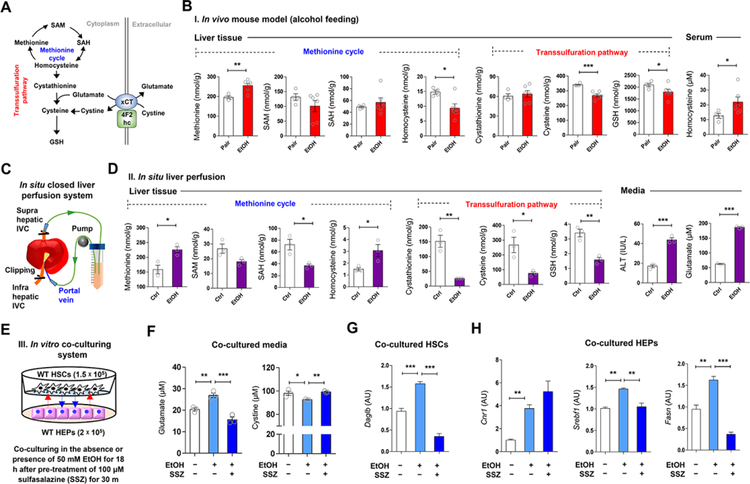
Figure 3. Alcohol-induced alteration of methionine cycle and transsulfuration pathway in the liver.
(A) Graphical representation of transsulfuration pathway and xCT-mediated glutathione biosynthesis.
(B) Concentrations of methionine, SAM, SAH, homocysteine, cystathionine, cysteine, and GSH in liver tissue and serum homocysteine levels from pair-fed (n = 4) and EtOH-fed (n = 6) mice for 8 weeks.
(C and D) in situ closed liver perfusion system (C) were used for concentration measurements of methionine, SAM, SAH, homocysteine, cystathionine, cysteine, and GSH in WT mouse livers (n = 3/group) by circulating media containing 50 mM ethanol, and medium levels of ALT and glutamate (D).
(E) in vitro co-culturing HEPs with HSCs in the presence of ethanol plus sulfasalazine (SSZ) (3 replicates).
(F-H) Concentration of glutamate and cystine in media (n = 3/each) (F), and relative mRNA expression of Daglb in co-cultured HSCs (G) and those of Cnr1, Srebf1, and Fasn in HEPs (H).
Data are presented as mean ± SEM. *P < 0.05, **P < 0.01, ***P < 0.001.
See also Figure S2.

