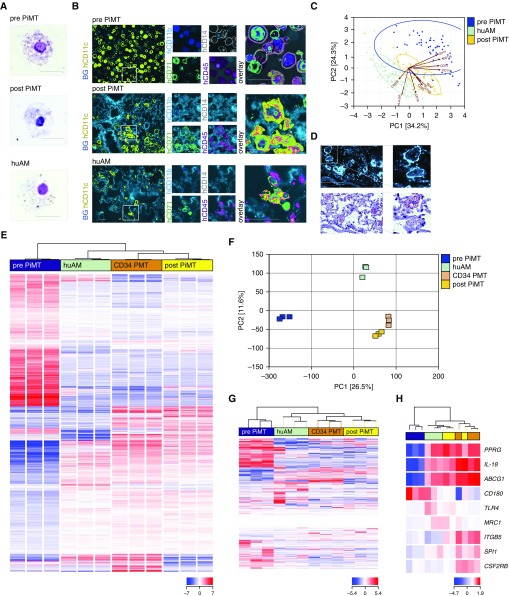
Figure 3.
Phenotypic changes and protein and gene expression of induced pluripotent stem cell (iPSC)–derived macrophages 2 months after pulmonary transplantation therapy. (A) Cytospin appearance of iPSC-derived macrophages before and after transplantation (pulmonary iPSC-based macrophage transplantation [PiMT]) compared with primary human alveolar macrophages (huAMs; scale bar, 50 μm; representative experiment of three). (B) Surface protein expression and (C) principal component analysis (PCA) of 10 surface markers analyzed by chip cytometry of cells before and after PiMT, compared with the phenotype of human primary AMs within a lung specimen of a healthy human organ donor (representative experiment of two). Scale bar in B, 20 μm. (D) In situ staining of recipient lung tissue for human CD45 and oil red O staining of respective cells reveal intracellular lipoprotein uptake within recipient humanized pulmonary alveolar proteinosis (huPAP) lungs (scale bar, 50 μm; representative experiment of two). (E) Hierarchical clustering of 2,381 transcripts differentially expressed in the analyzed cell populations. One-way ANOVA testing was conducted to identify transcripts showing the most reliable mRNA expression differences in any of the possible pairwise comparisons between cells before (blue; pre-PiMT) and after transplantation (yellow; post-PiMT), primary huAMs (green) and alveolar macrophage–like cells reisolated from huPAP lungs 5 months after CD34 cell–based pulmonary macrophage transplantation (orange; CD34 PMT) (corrected P value < 0.01 according to Benjamini-Hochberg correction). Samples and transcripts were hierarchically clustered (distance metric, Euclidean; linkage rule, Ward’s). Red color indicates elevated relative mRNA expression levels, whereas blue color represents diminished mRNA levels. (F) PCA was conducted with unfiltered quantified RNA-Seq data. A two-dimensional representation focusing on main components 1 (26.52% of variance) and 2 (11.55% of variance) is depicted. (G and H) Hierarchical clustering of selected gene sets for (G) iPSC-determining and (H) AM-relevant genes, further illustrating the changes of iPSC-derived macrophages into AM-like cells after PiMT (at least three biological replicates from at least two independent experiments per cell type). ABCG1 = ATP binding cassette subfamily G member 1; BG = background; CSF2RB = granulocyte–macrophage colony–stimulating factor 2 receptor B; hCD45 = human CD45; ITGB5 = integrin β-5; MRC1 = mannose receptor 1; PC = principal component; PPRG = peroxisome proliferator–activated receptor-γ; SPI = spleen focus forming virus (SFFV) proviral integration oncogene (transcription factor PU.1); TLR4 = Toll-like receptor 4.

