
Figure 1.
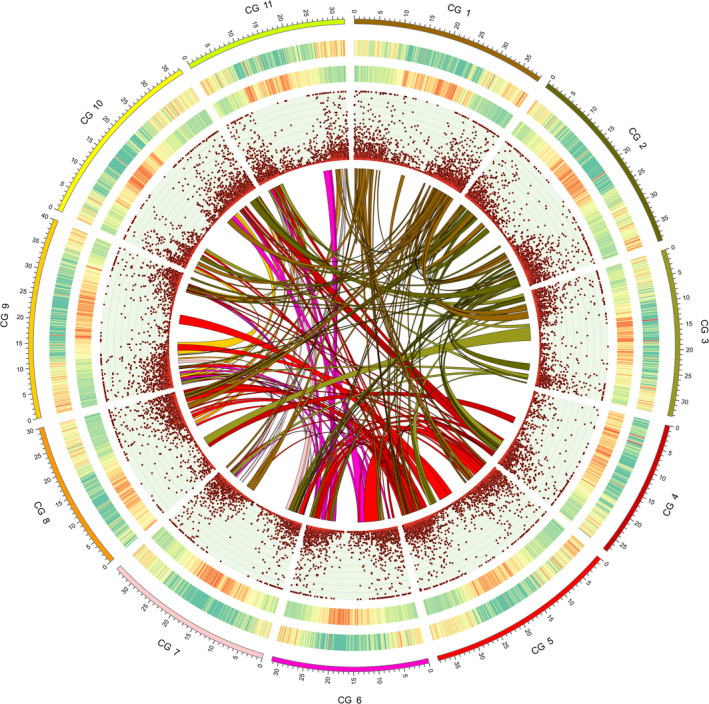
Genomic landscape of watermelon, ‘Charleston Gray’. The outermost circle is the ideogram of 11 chromosomes in Mb scale, followed by circles of gene density and TE density represented by percentage of genomic regions covered by genes and repeat sequences in 200‐kb windows, respectively (green to red, low to high), gene expression levels (RPKM; Maximum = 200) and syntenic blocks within the genome depicted by lines.