
Figure 3.
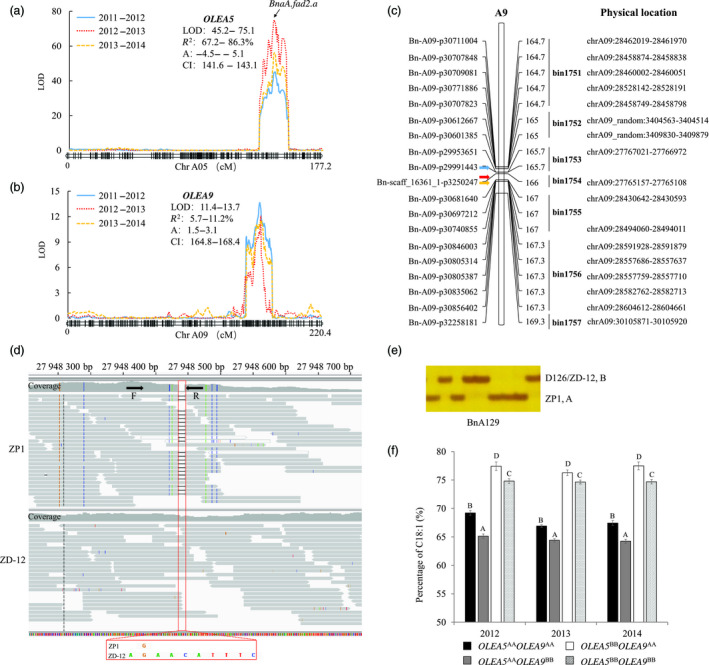
Identification of a novel QTL for oleic acid (C18:1) content on chromosome A9. (a and b) Two major QTLs of OLEA5 (a) and OLEA9 (b) were mapped separately. Curves of different colours represent QTL scanned from different seasons. The BnaA.fad2.a was responsible for OLEA5 demonstrated by our previous study (Yang et al., 2012b) and was located on the peak of OLEA5. (c) Physical localization of OLEA9 base on the physical location of the SNP markers in its confidence intervals (bin1751–bin1757). Arrows indicate the peak positions of OLEA9 detected in three seasons. (d) A closely linked InDel marker BnA129 (at 27.94 Mb) was developed for OLEA9 according to the resequencing data. The mapping result was displayed by Integrative Genomics Viewer. The red box indicates the positions of InDel. The arrows indicate the forward (F) and reverse (R) primer for BnA129. (e) The PCR‐amplified product of BnA129 was separated by 6% denaturing polyacrylamide gels and stained with silver. (f) Effects of individual or combined locus of OLEA5 and OLEA9 on C18:1 content in the ZD‐DH population as revealed by allelic genotype grouping. Allele‐specific marker YQ‐fad2a‐1 for OLEA5 (Yang et al., 2012b) and closely linked marker BnA129 for OLEA9 were used. AA and BB designate the allelic genotype same as parent ZP1 and D126 at a particular locus, respectively. Different uppercase letters indicate significant differences at P‐values < 0.01.