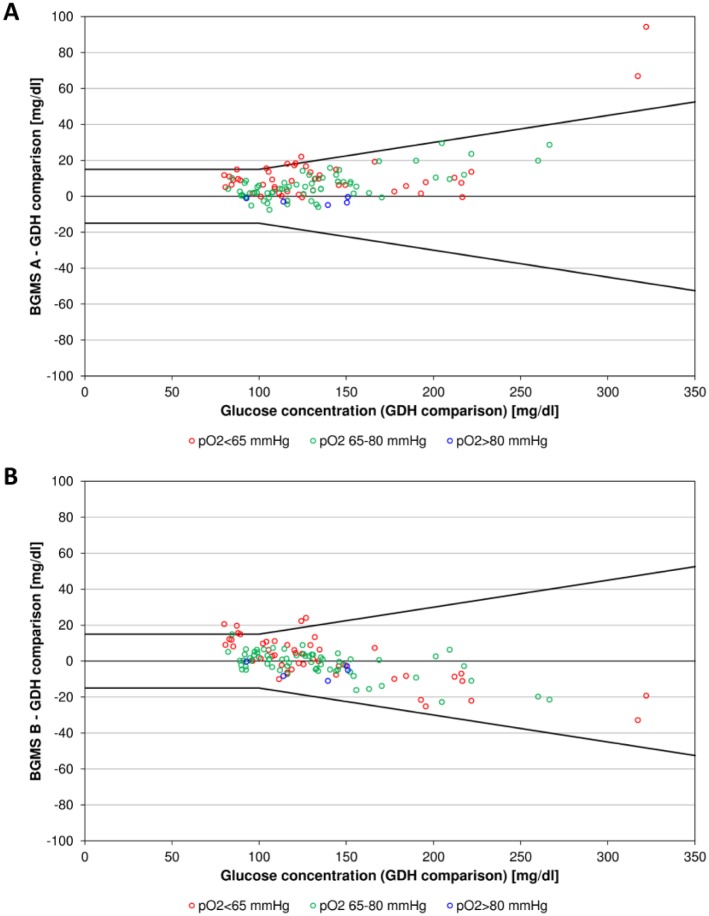
Figure 2.
Difference plots showing biases between mean glucose concentrations measured with GOx-based BGMS A (A) and B (B) and pO2-independent comparison BGMS C plotted versus glucose concentrations measured with BGMS C. Data points are colored depending on the category in which the sample’s pO2 value fell (<65 mmHg, 65-80 mmHg, >80 mmHg). The black lines indicating differences from the comparison measurements of ±15 mg/dl at glucose concentrations <100 mg/dl and ±15% at glucose concentrations ≥100 mg/dl are included for visual guidance.

