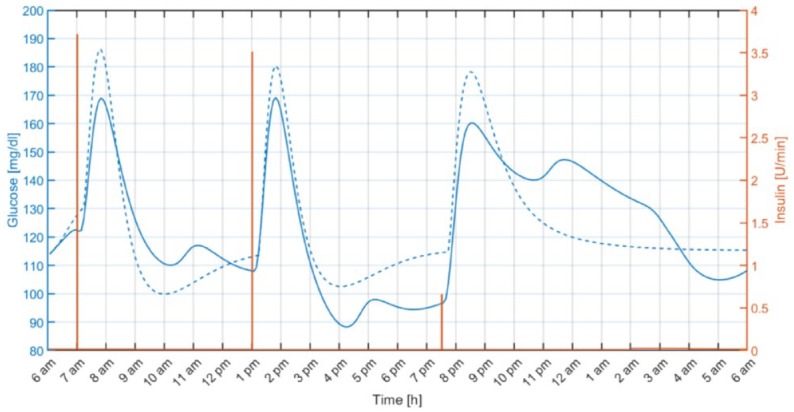
Figure 1.

Example of identification results for one of the in silico adults. The solid blue line represents the daily glucose profile generated using the UVA/Padova simulator and the dashed blue line is the glucose predicted by the identified model. The orange line indicates the insulin boluses and basal pattern.
