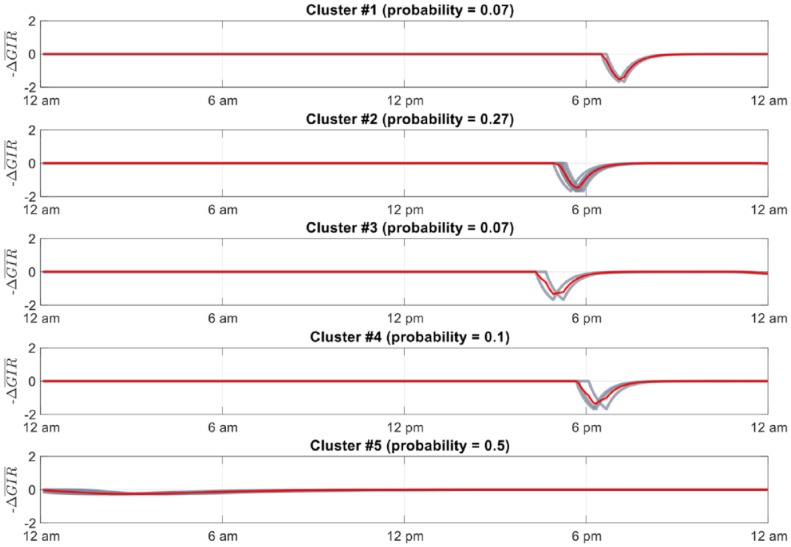
Figure 3.

Clustered glucose uptake signals for 30 days of a representative subject’s exercise data. Red lines show profile (average) trace. Black lines show each trace represented in the cluster. Probability of each cluster occurring shown above each respective subplot.
