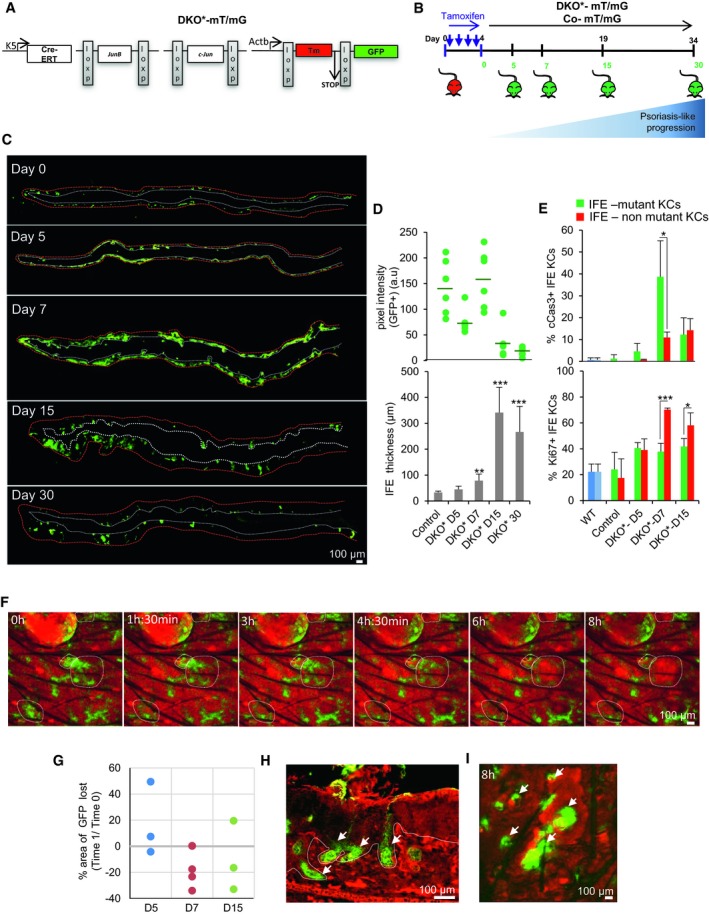
Figure 2. Mutant and non‐mutant inter‐follicular keratinocytes have different proliferation and apoptotic rates during psoriasis‐like disease progression.

-
ASchematic representation of the JunB and c‐Jun double knockout mouse model (DKO*) with lineage tracing used to investigate the psoriasis‐like disease development in mice. Briefly, DKO* psoriasis‐like mouse model was generated by the cross of mice carrying the floxed JunB allele (JunB f/f) and floxed c‐Jun allele (c‐Jun f/f) with the transgenic mice expressing the Cre recombinase–estrogen receptor fusion under the control of the basal keratinocyte‐specific K5 promoter (K5‐Cre‐ERT) to obtain JunB f/f c‐Jun f/f K5‐Cre‐ERT mice. To trace epidermal‐specific deletion of JunB f/f and c‐Jun f/f in DKO* mice, global double‐fluorescent Cre reporter mouse Gt(ROSA)26Sortm4(ACTB‐tdTomato,‐EGFP)Luo/J (referred as mT/mG) was crossed with DKO* mice (referred as DKO*‐mT/mG).
-
BExperimental timeline to induce psoriasis‐like disease in 8‐week‐old mice with four consecutive doses of tamoxifen injections (2 mg). Upon induction, non‐mutant keratinocytes express Tomato, while mutant keratinocytes express GFP. GFP expression was analyzed at 0, 5, 7, 15, and 30 days post‐induction.
-
CComposite immunofluorescence images showing GFP expression of whole ear sections from DKO*‐mT/mG mice at day 5, 7, 15, and 30. Increased GFP expression is shown at day 7 followed by progressive decrease of GFP+ keratinocytes (white dotted line represents basal layer, and red dotted line represents outermost skin layer). n = 3 per time point.
-
DQuantification analysis of GFP expression (top) and epidermal thickness (bottom) of DKO* mice at different time points during psoriasis‐like disease progression. n = 6 per time point. Data represent mean ± SD. Statistical significance **P < 0.01, ***P < 0.001 (Student's two‐tailed t‐test relative to control group). See Appendix Table S2 for exact P‐values.
-
EQuantification analysis of cleaved caspase‐3 (cCas3, top) and Ki67 (bottom) in ear skin of DKO* mice at different time points during psoriasis‐like disease progression. n = 3 per time point. Data represent mean ± SD. Statistical significance *P < 0.05, ***P < 0.001 (Student's two‐tailed t‐test). See Appendix Table S2 for exact P‐values.
-
FIntravital confocal time‐lapse imaging of non‐mutant Tomato keratinocytes and mutant GFP keratinocytes of DKO*‐mT/mG at day 7 after first tamoxifen injection. Dotted circles emphasize areas in which mutant GFP+ keratinocytes are replaced by non‐mutant Tomato+ keratinocytes.
-
GPercentage of GFP+ area eliminated during intravital confocal time‐lapse imaging at day 5, 7, and 15 in DKO*‐mT/mG mice (Time‐lapse 1:8 h). Positive value: Area of GFP increased. Negative value: Area of GFP reduced.
-
HFluorescence imaging of DKO*‐mT/mG ear skin at day 30 after first tamoxifen injection shows that remaining mutant GFP+ keratinocytes reside along the hair follicles. White dotted line separates epidermis and dermis. White arrows represent GFP+ hair follicles.
-
IIntravital confocal time‐lapse imaging of DKO*‐mT/mG at day 15 after first tamoxifen injection. Mutant GFP+ keratinocytes (white arrows) are maintained around hair follicles. White arrows represent GFP+ hair follicles.
Source data are available online for this figure.
