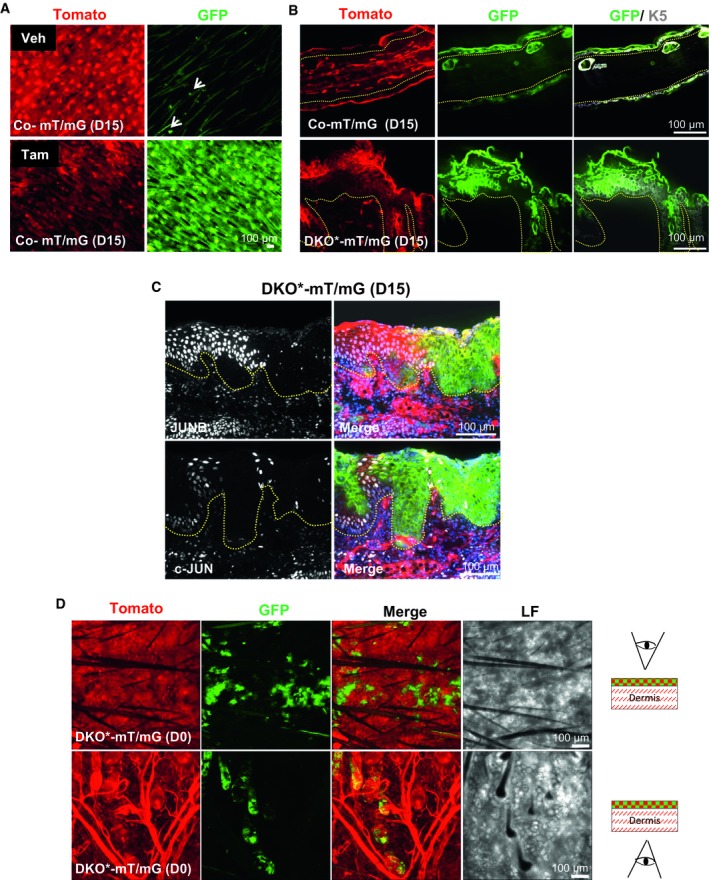
Figure EV2. Validation of the lineage tracing system in Co‐mT/mG and DKO*‐mT/mG mice (related to Fig 2).

-
AWhole mount of ear skin from co‐mT/mG mice before (VEHICLE) and after tamoxifen at day 15. White arrows represent isolated spots of GFP in vehicle skin.
-
BImmunofluorescence images of Co‐mT/mG ear skin sections and DKO*‐mT/mG at day 15 after tamoxifen treatment, co‐stained with K5 (white). Yellow dotted line separates epidermis and dermis.
-
CImmunofluorescence images of c‐Jun and JunB staining in DKO*‐mT/mG at day 15 after tamoxifen treatment showing GFP+ keratinocytes are negative for c‐Jun and JunB expression. GFP (green), Tomato (red), JunB and c‐Jun (white), DAPI (blue). Yellow dotted line separates epidermis and dermis.
-
DRepresentative images of whole mounts of ear skin from DKO*‐mT/mG at day 0 after tamoxifen treatment in two views, from the epidermis and from the dermis, to distinguish the expression of GFP+ epidermal cell into the IFE and HFs.
