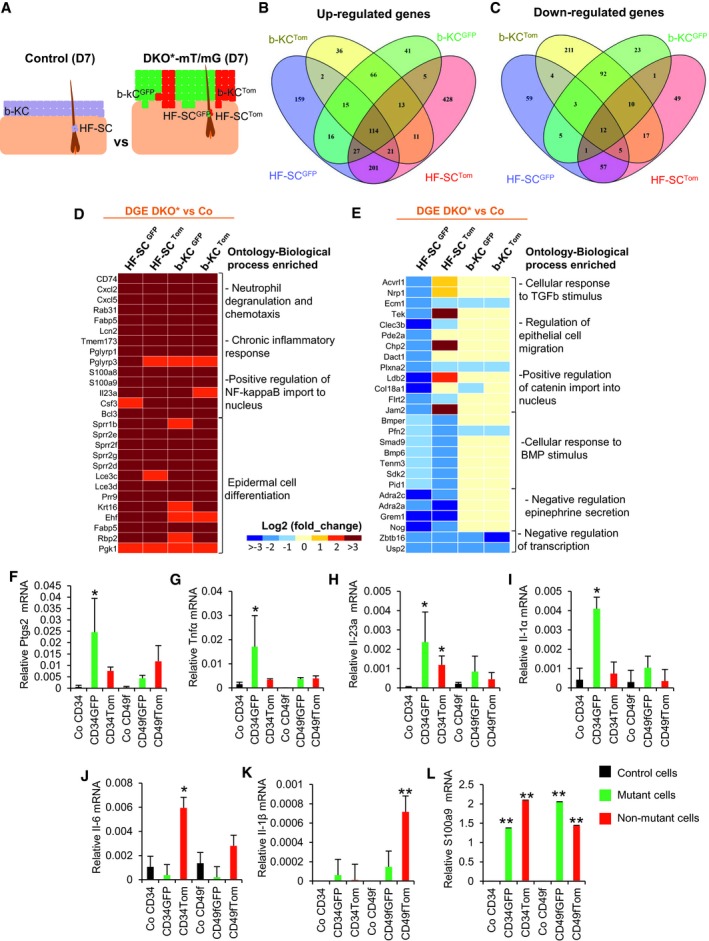
Figure EV4. Isolation of bulge HF‐SCs and basal keratinocytes from Co‐mT/mG and DKO*‐mT/mG ear skin for RNA‐seq and gene expression profiling (related to Fig 5).

-
AHair follicle stem cells (HF‐SC, CD34+ CD49fhigh) and basal keratinocytes (b‐KC, CD49fhigh) from ear skin of DKO*‐mT/mG collected at day 7 after tamoxifen induction were sorted by FACS for GFP+ vs. Tomato+. HF‐SCs (CD34+ CD49fhigh) and b‐KC (CD49fhigh) from control mice were also sorted to sequence the RNA. n = 3 mice per condition. Differentially expressed genes were obtained by the comparison of mutant cell populations with their same cell populations from control mice.
-
B, COverlapping of differentially expressed genes (DEGs) from the four subpopulations (HF‐SCGFP; HF‐SCTom; b‐KCGFP; and b‐KCTom) by Venn diagram.
-
D, EHeat map of up (C)‐ and down (D)‐regulated biological processes based on Gene Ontology IDs for DEGs commonly up‐ and down‐regulated in the four subpopulations (HF‐SCGFP; HF‐SCTom; b‐KCGFP; and b‐KCTom)
-
F–LGene expression for Ptgs2, TNFa, IL‐23a, IL‐1α, IL‐6, IL‐1β, and S100a9 in the different epidermal cell subpopulations sorted at mid‐term of psoriasis‐like development from DKO* mice. n = 3 mice. Data represent mean ± SD. Statistical significance *P < 0.05, **P < 0.01 (Student's two‐tailed t‐test relative to control groups). See Appendix Table S2 for exact P‐values.
