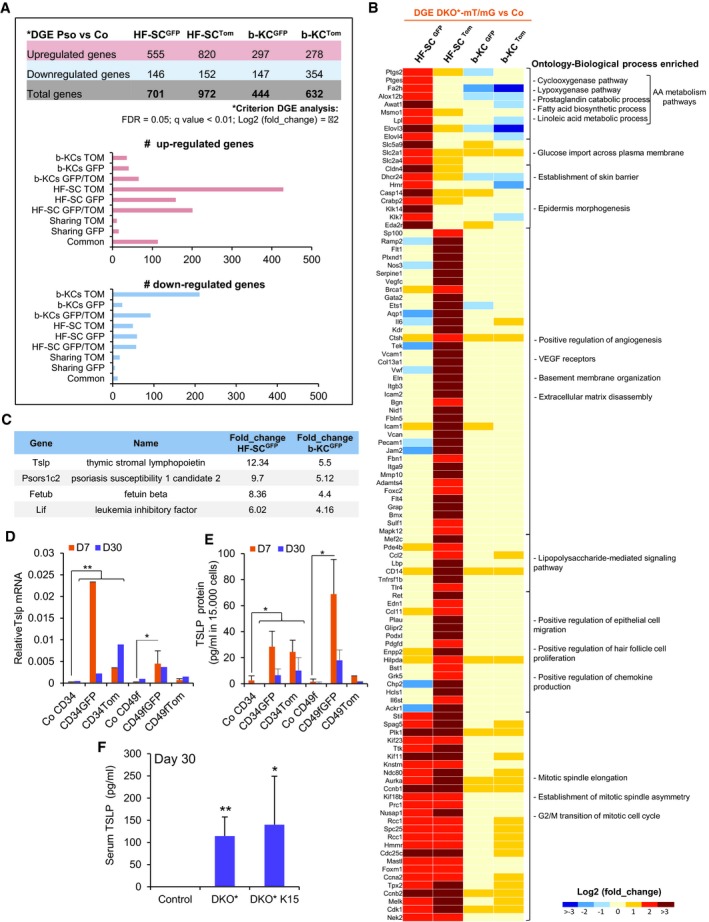
Figure 5. Different molecular signatures of mutant and non‐mutant epidermal stem cells (EpSCs).

-
ADifferentially expressed genes (DEGs) from the four subpopulations (bulge HF‐SCGFP; bulge HF‐SCTom; b‐KCGFP; and b‐KCTom) from psoriatic DKO*‐mT/mG mice in comparison with their control counterparts (Co). The graphs represent the number of genes differentially up‐regulated or down‐regulated specifically in each group of interest obtained by Venn diagram analysis (Fig EV4B and C).
-
BHeat map for specific genes relative to biological process enriched based on Gene Ontology IDs for DEGs that are: (i) exclusively up‐regulated in HF‐SCGFP; (ii) exclusively up‐regulated in HF‐SCTom; (iii) commonly up‐regulated in HF‐SCGFP and HF‐SCTom.
-
CPrediction of secreted proteins enriched in GFP+ subpopulations by the analysis of DEG commonly up‐regulated in HF‐SCGFP and b‐KCGFP by ProteINSIDE analysis of RNA‐seq.
-
D, EGene and protein expression of TSLP in different epidermal cell subpopulations sorted at mid‐term (D7) or late term (D30) of psoriasis‐like progression in DKO* mice. n = 2–3. Data represent mean ± SD. Statistical significance *P < 0.05, **P < 0.01 (Student's two‐tailed t‐test relative to control groups). See Appendix Table S2 for exact P‐values.
-
FQuantification of TSLP production in sera of control, DKO*, and DKO* K15 mice at day 30 of psoriasis‐like disease by ELISA. n = 4 per group. Data represent mean ± SD. Statistical significance *P < 0.05, **P < 0.01 (Student's two‐tailed t‐test relative to controls). See Appendix Table S2 for exact P‐values.
Source data are available online for this figure.
