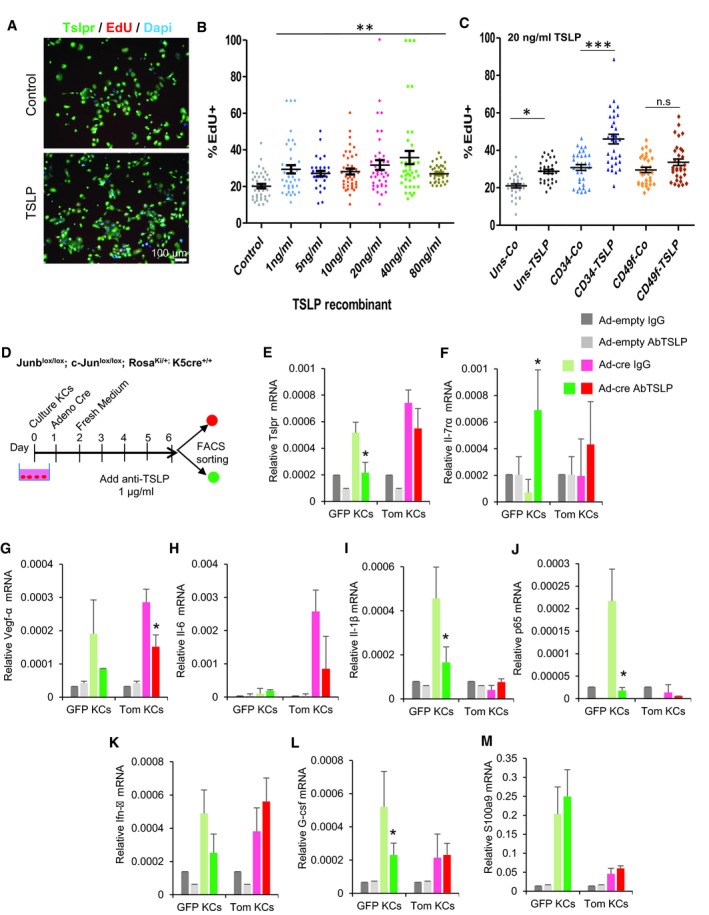
Figure EV5. Regulation of keratinocyte proliferation and pro‐inflammatory mediators by TSLP (related to Fig 6).

-
AImmunofluorescence images of TSLPR (green) and EdU (red) staining in primary keratinocyte cultures from wild‐type (WT) mouse skin treated with recombinant TSLP during 48 h.
-
BPercentage of EdU+ WT keratinocytes after blocking with recombinant TSLP at different concentrations in culture. WT keratinocytes responded to recombinant TSLP treatment and increased their proliferation. n = 3 independent experiments. Data represent mean ± SD. Statistical significance **P < 0.01 (two‐way ANOVA and Bonferroni post‐test). See Appendix Table S2 for exact P‐values.
-
CPercentage of EdU+ WT keratinocytes derived from bulge HF‐SCs (CD34+) and basal keratinocytes (CD49f+) after treating with TSLP recombinant in culture. Bulge HF‐SCs increased the proliferation rate rather than basal keratinocytes. n = 2 independent experiments. Data represent mean ± SD. Statistical significance *P < 0.05, ***P < 0.001 (two‐way ANOVA and Bonferroni post‐test). See Appendix Table S2 for exact P‐values.
-
DExperimental design for induction of mutantGFP KCs in vitro and neutralization of secreted TSLP by anti‐TSLP. Primary keratinocytes were cultured from the skin of Junblox/lox; c‐Junlox/lox; RosaKi/+; and K5cre‐ERT+/+ mice. 50% of mutantGFP KCs were induced by infection with Cre Adenovirus, and the non‐infected cells were non‐mutantTom KCs. Adeno‐empty was used as control. After neutralization, GFP+ and Tomato+ KCs were sorted by FACS and RNA isolation was carried out for further gene expression profiling.
-
E–MGene expression profiling of Tslpr, IL‐7ra, VEGFα, IL‐6, IL‐1β, p65, IFN‐γ, G‐CSF, and S100a9 in sorted GFP vs. Tom KCs after TSLP neutralization. n = 2 independent experiments. Data represent mean ± SD. Statistical significance *P < 0.05 (Student's two‐tailed t‐test relative to control group). See Appendix Table S2 for exact P‐value.
