
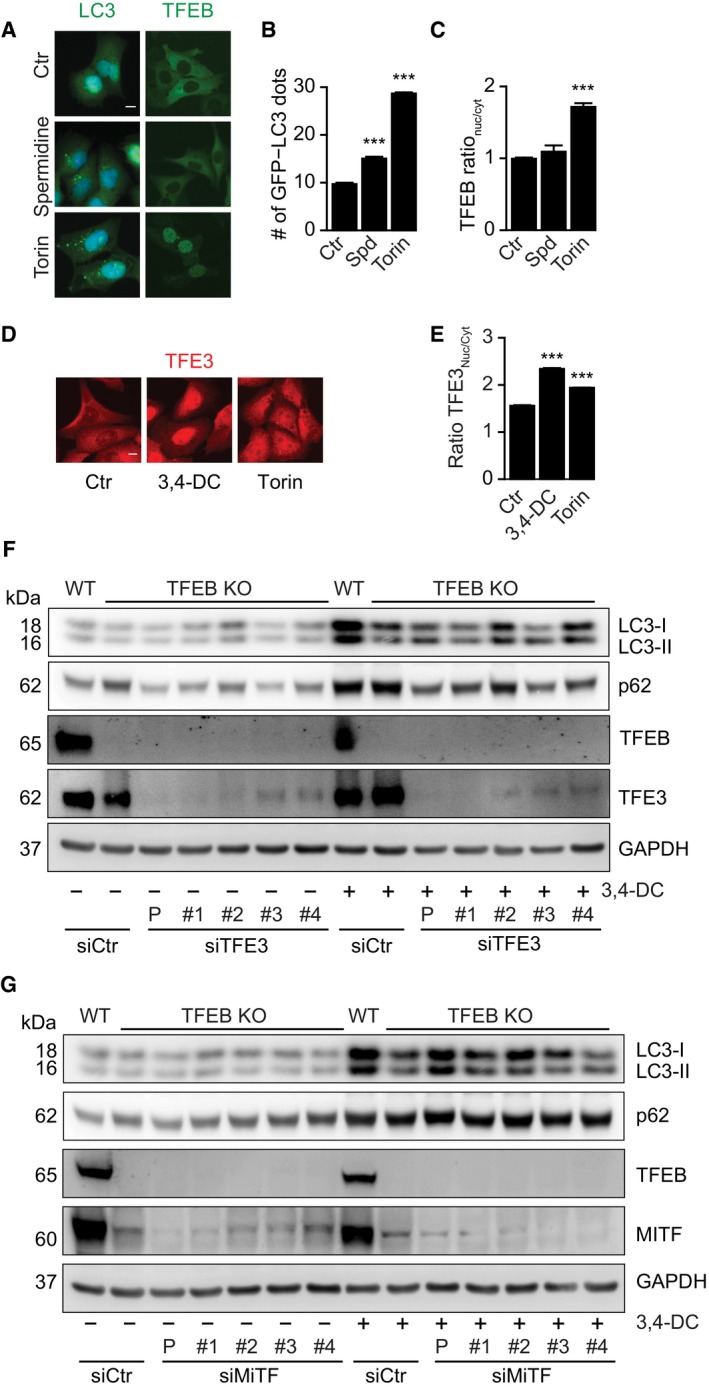
Figure EV3. Induction of p62 expression by 3,4‐DC requires TFE3.
-
A–CU2OS cells stably expressing GFP‐LC3 or TFEB‐GFP were treated with spermidine or torin1 as indicated, and GFP‐LC3 dot formation (B) and TFEB‐GFP nuclear translocation (C) were quantified. Data are means ± SD of triplicate assessments (***P < 0.001; Student's t‐test). Representative images are shown in (A). Scale bar equals 10 μm.
-
D, EEndogenous TFE3 in U2OS cells was detected by immunofluorescence after 6 h of treatment with 3,4‐DC or torin1. TFE3 intensity in nuclei and cytoplasm was measured, and their ratio was calculated in (E). Data are means ± SD of four replicates (***P < 0.001; Student's t‐test). Representative images are shown in (D). Scale bar equals 10 μm.
-
F, GU2OS wild‐type or TFEB KO cells transfected with four individual siRNA oligos specifically targeting TFE3 (F) or MITF (G) (1#, 2#, 3#, and 4#) or a collection of the four individual siRNAs (s#), or non‐targeting scramble siRNA (siCtr) were treated with or without 30 μM 3,4‐DC for 16 h, as indicated. SDS–PAGE and immunoblot were performed to detect LC3, p62, and GAPDH protein levels. Samples for immunoblots were run on parallel gels, then blotted, cut into stripes, and probed separately.
Source data are available online for this figure.