-
A, B
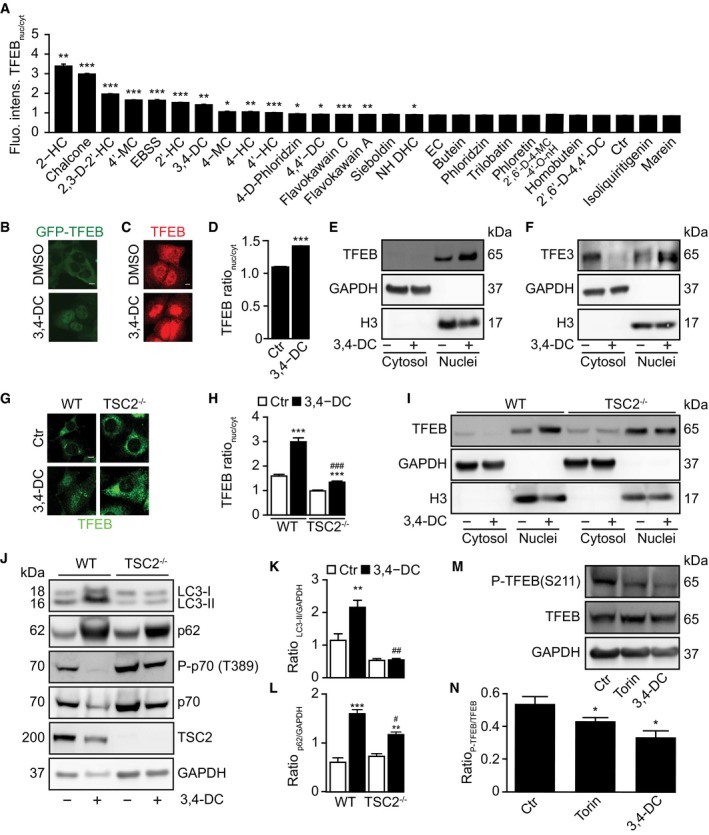
U2OS cells stably expressing GFP‐TFEB fusion protein were treated with indicated chalcones at 30 μM for 6 h. GFP intensities in nuclei and cytoplasm were measured, and the ratio of GFP intensities in nuclei and cytoplasm was calculated to indicate TFEB translocation to nuclei (A). Data are means ± SD of four replicates (*P < 0.05;**P < 0.01;***P < 0.001; Student's t‐test). Representative images are shown in (B). Scale bar equals 10 μm.
-
C, D
U2OS cells were treated with 30 μM 3,4‐DC for 6 h, and then, endogenous TFEB translocation was assessed by immunostaining (C). TFEB intensities in nuclei and cytoplasm were measured, and the ratio of TFEB intensities in nuclei and cytoplasm was calculated to indicate TFEB translocation to nuclei (D). Data are means ± SD of four replicates (***P < 0.001; Student's t‐test). Representative images are shown in (C). Scale bar equals 10 μm.
-
E, F
U2OS cells were treated with 30 μM 3,4‐DC for 6 h or were left untreated. Cytoplasmic and nuclear fractions were assessed for nuclear translocation of the transcription factors TFEB and TFE3 by SDS–PAGE.
-
G–I
MEF wild‐type and TSC2 knockout (TSC2 KO) cells were treated with 3,4‐DC for 6 h. The cells were fixed, and immunofluorescence was performed to detect endogenous TFEB. The ratio of TFEB intensities between nuclei and cytoplasm was calculated in (H). Data are means ± SD of eight replicates (***P < 0.001 vs. Ctr; ###
P < 0.001 vs. WT/3,4‐DC; Student's t‐test). Representative images are shown in (G). Scale bar equals 10 μm. (I) After the treatment, nuclei were isolated and Western blot was performed to detect nuclear and cytosolic TFEB protein levels.
-
J–L
MEF wild‐type and TSC2 KO cells were collected and lysed for Western blot after the treatment with 3,4‐DC. Antibodies against LC3, p62, TSC2, or GAPDH were administrated to detect protein levels, and phosphorylation of mTOR substrate p70 S6K at threonine 389 (T389) was measured with the phosphorylation‐specific antibody (P‐p70(T389)) and anti‐p70 antibody. The band intensities of LC3‐II, p62, and GAPDH were measured with ImageJ, and the ratios of LC3‐II/GAPDH and p62/GAPDH were calculated in (K) and (L). Data are means ± SEM of at least three independent experiments (**P < 0.01, ***P < 0.001 vs. Ctr; #
P < 0.05, ##
P < 0.01 vs. WT/3,4‐DC; Student's t‐test).
-
M, N
U2OS cells treated with 3,4‐DC or torin for 6 h were collected and processed for Western blot. TFEB phosphorylation at serine 211 was checked with the phosphorylation‐specific antibody (P‐TFEB(S211)), and total TFEB protein level was also detected with anti‐TFEB. The band intensities of P‐TFEB and total TFEB were measured with ImageJ, and their ratio was calculated in (N). Data are means ± SEM of at least three independent experiments (*P < 0.05 vs. Ctr; Student's t‐test).
Data information: Samples for immunoblots were run together in one gel (E, F) or in several parallel gels (I, J, M), then blots were cut into horizontal stripes, and probed separately. Blots probed for P‐p70 were stripped and reprobed to detect p70 independently from its phosphorylation status.