-
A–D
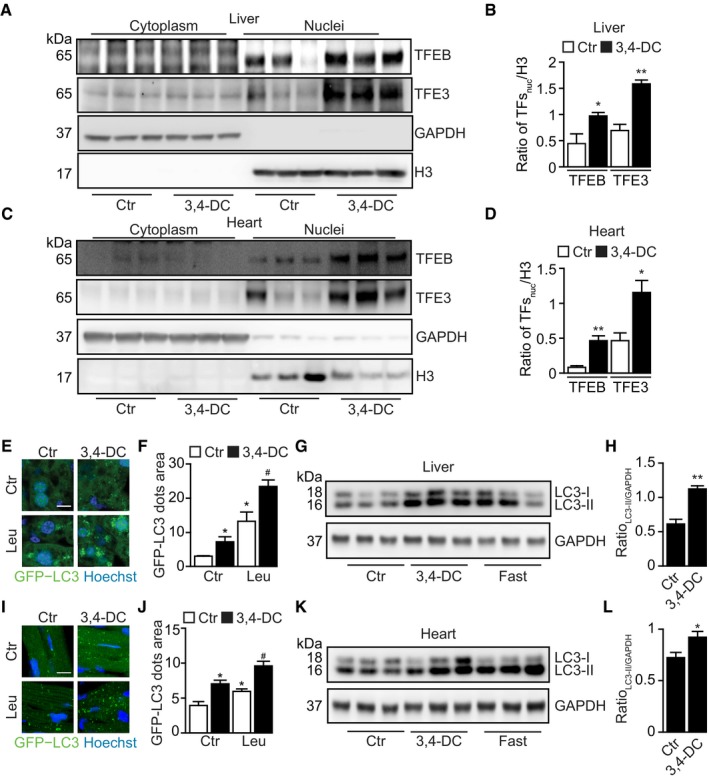
Female C57/BL6 animals were treated with 3,4‐DC for 24 h. Following this, liver and heart tissues were excised and cells were subjected to subcellular fractionation. Thereafter, proteins were separated by SDS–PAGE and immunoblots were performed to detect the nuclear translocation of TFEB and TFE3 (A, C). GAPDH and H3 were used as controls for cytosolic and nuclear fractions, respectively. Band intensities of nuclear TFEB, TFE3, and H3 were measured, and ratios of nuclear TFs vs. H3 (TFsnuc/H3) were calculated in (B, D). Data are means ± SEM of at least three mice (*P < 0.05, **P < 0.01; vs. Ctr; Student's t‐test).
-
E, F
GFP‐LC3‐expressing mice were i.p. injected with 3,4‐DC for 24 h. Leupeptin (Leu) was used to test autophagic flux in vivo, and GFP‐LC3 dots were measured in liver tissue. Data are means ± SEM of at least three mice (*P < 0.05 vs. Ctr without Leu; #
P < 0.05 vs. Ctr with Leu; Student's t‐test). Scale bar equals 10 μm.
-
G, H
C57/BL6 mice were i.p. injected with 3,4‐DC or were starved for 24 h. Following this, liver tissue was excised and subjected to SDS–PAGE and immunoblot (G). GAPDH was measured as a loading control. Band intensities of GAPDH and LC3‐II were measured, and ratios LC3‐II vs. GAPDH (LC3‐II/GAPDH) were calculated in (H). Data are means ± SEM of at least three mice (**P < 0.01; Student's t‐test).
-
I, J
GFP‐LC3‐expressing mice were i.p. injected with 3,4‐DC for 24 h. Leupeptin (Leu) was used to test autophagic flux in vivo, and GFP‐LC3 dots were measured in heart tissue. Data are means ± SEM of at least three mice (*P < 0.05 vs. Ctr without Leu; #
P < 0.05 vs. Ctr with Leu; Student's t‐test). Scale bar equals 10 μm.
-
K, L
C57/BL6 mice were i.p. injected with 3,4‐DC or were starved for 24 h. Following this, heart tissue was excised and subjected to SDS–PAGE and immunoblot (K). GAPDH was measured as a loading control. Band intensities of GAPDH and LC3‐II were measured, and ratios LC3‐II vs. GAPDH (LC3‐II/GAPDH) were calculated in (L). Data are means ± SEM of at least three mice (*P < 0.05; Student's t‐test).
Data information: Samples for immunoblots were run together on the same gel (G, K) or on parallel gels (A, C), then blotted, cut into horizontal stripes, and probed separately.