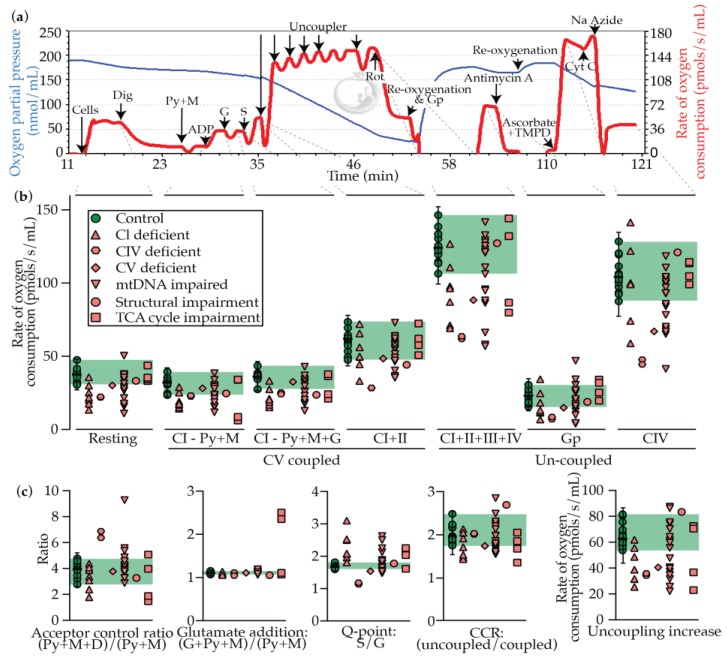
Figure 3.
Oxygraphy testing in control and PMD patient fibroblast cells. (a) Representative trace from control fibroblasts, with substrates and inhibitors injected as described. Blue line indicates the oxygen partial pressure in the chamber, and the red line indicates the inverted rate of change of the blue line (rate of oxygen consumption). (b) Resting, coupled, and uncoupled rates of respiration. (c) Ratios and calculated values from data in panel (b). Median is displayed for controls with error bars showing the 1.25th and 98.75th percentiles of the reference range, and the green shading region shows the range. Each data point represents the average of each patient or control from ≥ 3 technical replicates. Abbreviations: As, ascorbate; CI–IV, respiratory chain complexes I–IV; CCR, coupling control ratio (maximal uncoupled activity over maximal coupled activity; Cyt C, cytochrome C; Dig, digitonin; Gp, Glycerophosphate; G, glutamate; M, malate; Py, pyruvate; Rot, rotenone; S, succinate.

