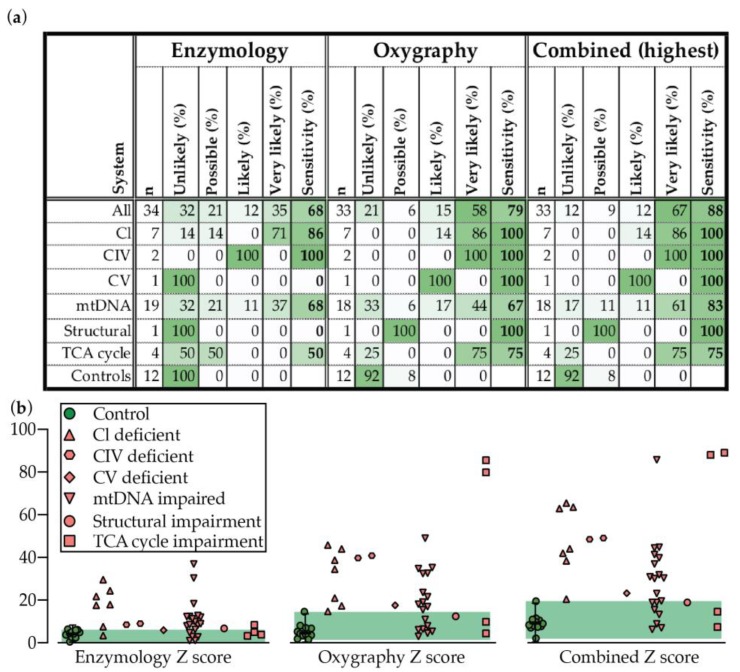
Figure 4.
Disease prediction and sensitivity for enzymology, oxygraphy, or combined methods for detecting PMD as presented (a) in a table, or (b) through the plotting of the combined positive Z scores for each test and combined value. Median is displayed for controls with error bars showing the 1.25th and 98.75th percentiles of the reference range, and the green shading region shows the range. Abbreviations: CI–CIV, respiratory chain complexes I–IV.

