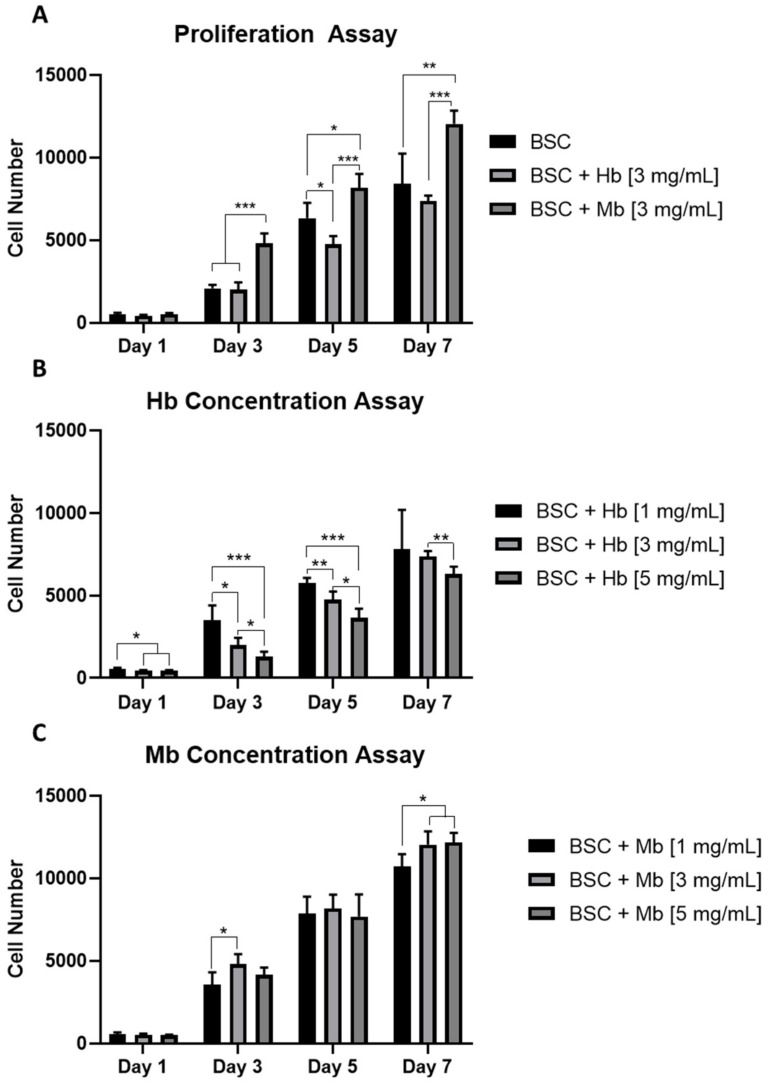
Figure 2.
Proliferation of BSCs grown in the presence of different Hb or Mb concentrations in 2D. (A) Cell number of BSCs, BSCs + 3 mg/mL Hb, or BSCs + 3 mg/mL Mb, quantified with CyQuant reagent (n = 6) after one, three, five, and seven days. BSCs proliferation with different concentrations of (B) Hb and (C) Mb, at 1, 3 or 5 mg/mL was observed (n = 6). Cell number was calculated from a standard curve prepared from cells seeded at known density. * p ≤ 0.05, ** p ≤ 0.01, *** p ≤ 0.001.

