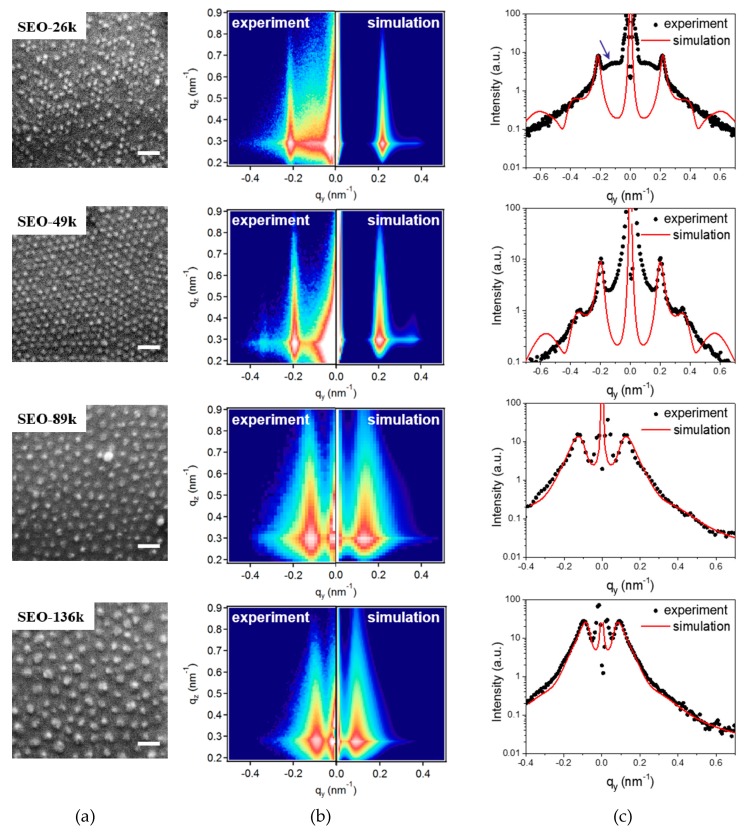
Figure 4.
(a) SEM images from CFO nanodots (scale bar 100 nm). The text in the white boxes reports the BCP template name (Table 1) used to prepare the CFO dot assemblies. (b) The corresponding experimental and simulated 2D grazing incident small-angle X-ray scattering (GISAXS) patterns. (c) The corresponding 1D GISAXS patterns along the qy direction together with the best-fit curves in red. The blue arrow in the 1D pattern of SEO-26k is a visual aid for a broad diffraction peak.

