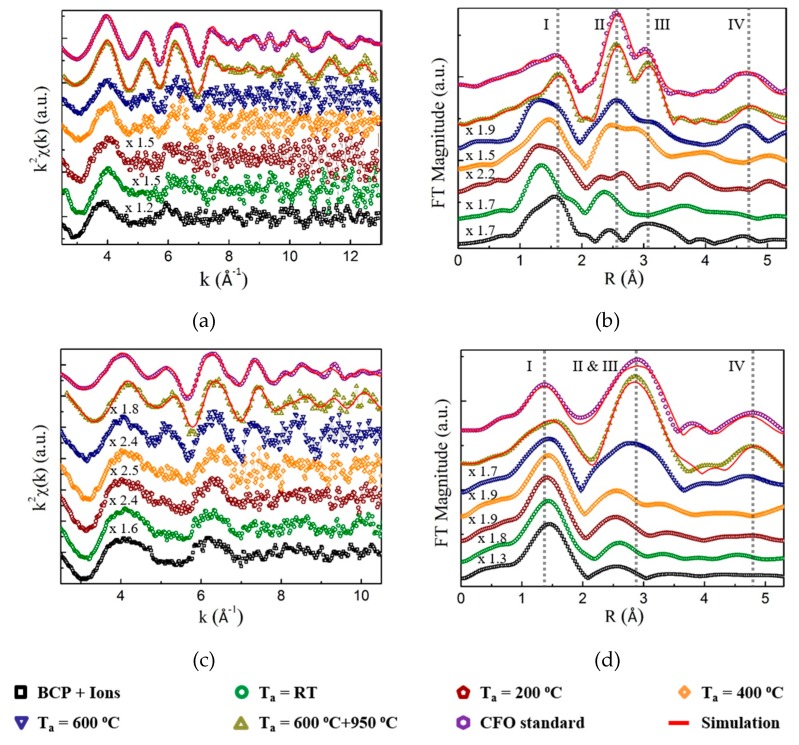
Figure 6.
X-ray absorption fine structure spectroscopy (EXAF) signals at (a) Co K-edge and (b) Fe K-edge. The corresponding Fourier transform magnitudes (FT magnitudes) at (c) Co K-edge and (d) Fe K-edge for samples at different preparation stages. All plots share the same sample sequence and color code. The solid red lines are the simulation results. The four dashed vertical lines in (b,d) are used to label the typical peak positions for different shells (see text).

