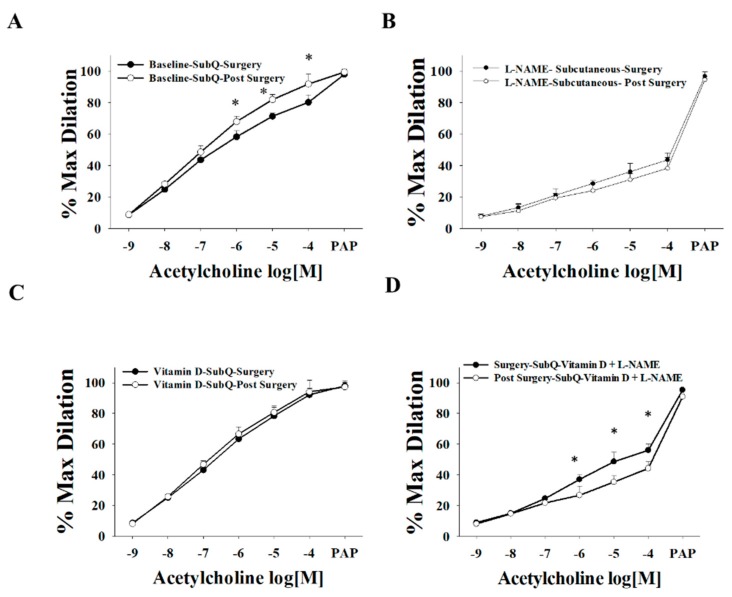
Figure 9.
Comparison of the AchID between SAT arterioles collected on the day of bariatric surgery and those collected three months after surgery. AchID measurements corresponding to increasing Ach concentrations (10−9 to 10−4 M) in SAT arterioles at baseline (A) and after incubation with L-NAME (B), vitamin D (C), and vitamin D plus L-NAME (D). All measures are represented as means ± SE; * p < 0.05 comparing post-surgery with surgery-obtained arterioles.

