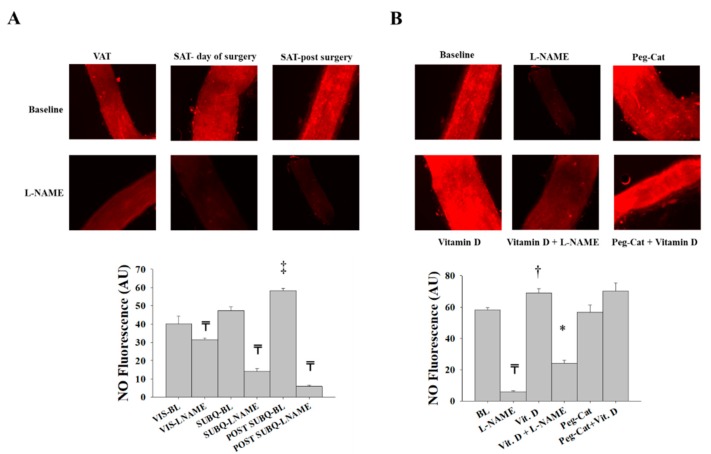
Figure 10.
NO production in isolated adipose tissue arterioles. (A) Representative images by fluorescence microscopy of NO generation conditions at baseline and after incubation with L-NAME in adipose tissue arterioles collected on the day of surgery (VAT and SAT day of surgery) and three months after surgery (SAT post-surgery). (B) Representative fluorescence microscopy images of NO generation conditions at baseline and after incubation with L-NAME, PEG-CAT, vitamin D, vitamin D plus L-NAME, and vitamin D plus PEG-CAT in SAT arterioles collected three months after surgery. Charts represent NO fluorescent signals that were measured and expressed in arbitrary units using NIH Image J software. All measures are represented as means ± SE; ₸ p < 0.05 comparing L-NAME with corresponding baseline in VAT, SAT day of surgery, and SAT post-surgery, ‡ p < 0.05 comparing SAT day of surgery and SAT post-surgery, † p < 0.05 comparing vitamin D with baseline, and * p < 0.05 comparing L-NAME + vitamin D with vitamin D alone.

