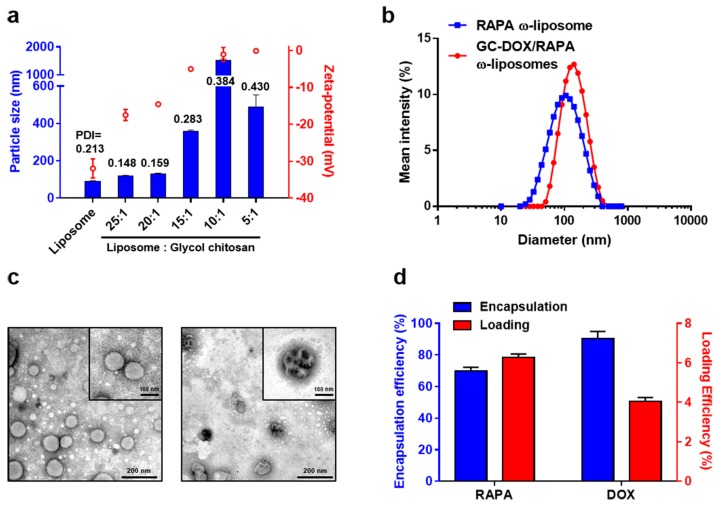
Figure 2.
(a) Mean particle size (blue), zeta-potential (red), and PDI (black) values of liposomes and glycol chitosan complexes with various ratios. (b) Size distribution for RAPA ω-liposomes (blue) and GC-DOX/RAPA ω-liposomes (red). (c) Transmission electron microscope images of RAPA ω-liposomes before (left panel) and after (right panel) complexation with GC-DOX. (Scale bar: 200 nm. Zoom: 100 nm) (d) Encapsulation efficiency (blue) and loading efficiency (red) of RAPA and DOX in GC-DOX/RAPA ω-liposomes.

