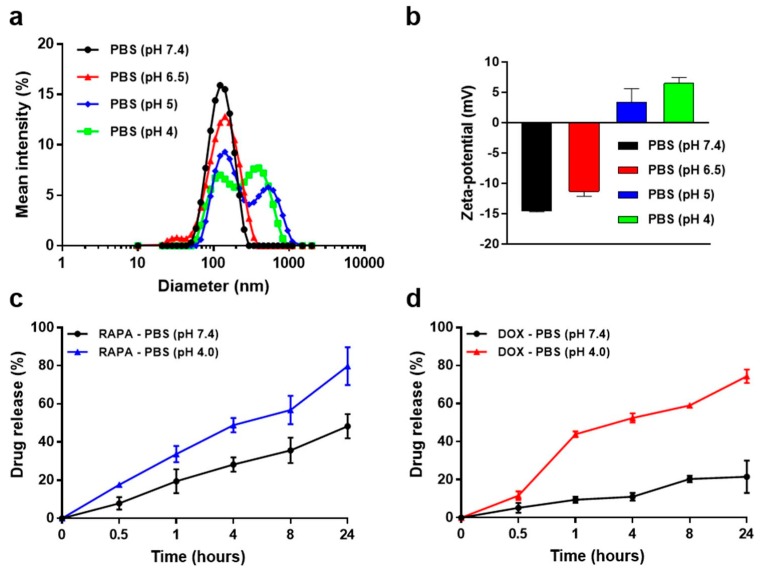
Figure 3.
(a) Size distribution profiles of GC-DOX/RAPA ω-liposomes in PBS solution with different pH (each analysis was measured after 24 h incubation). (b) Zeta-potential change of GC-DOX/RAPA ω-liposomes in PBS solutions with different pH. (c) In vitro RAPA release profile of GC-DOX/RAPA ω-liposomes in PBS at pH 4.0 or 7.4 at 37 °C (n = 3/time point). (d) In vitro DOX release profile of GC-DOX/RAPA ω-liposomes in PBS at pH 4.0 or 7.4 at 37 °C (n = 3/time point).

