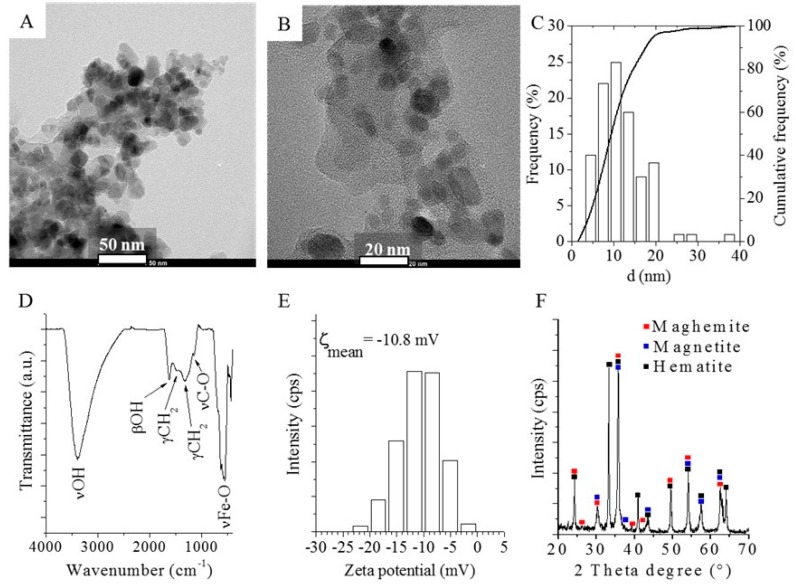
Figure 4.
HRTEM images (A,B) and size distribution (C) of the magnetic nanoparticles. Fourier Transformed Infrared (FTIR) spectrum of the iron-oxide surface with the identified functional groups (D). Zeta potential distribution of the nanoparticles in aqueous phase (E) and X-ray diffraction (XRD) pattern of the iron-oxide sample (F).

