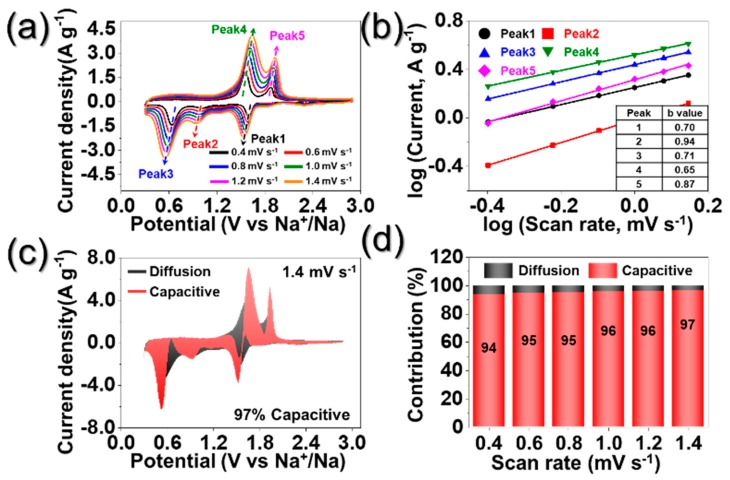
Figure 7.
Kinetics investigation: (a) CV curves at different scan rates; (b) corresponding log(i) vs. log(v) plots at each redox peak; (c) CV curve with the pseudocapacitive proportion at a scan rate of 1.4 mV s−1; and (d) bar chart exhibiting the percent of pseudocapacitive contribution at different scan rates; (i: peak current, v: scan rate).

