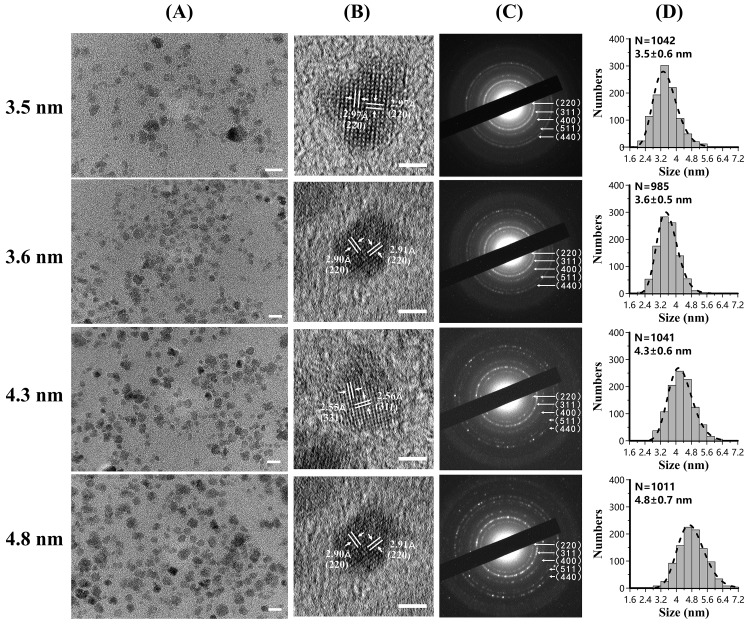
Figure 1.
Transmission electron microscopy (TEM) characterization for synthesized MHFn nanoparticles. Column (A). low resolution TEM images. Scale bar: 10 nm. Column (B). high resolution TEM images. Scale bar: 2 nm. Column (C). selected area electron diffraction images. Column (D). size distribution. N, number of particles measured. Dotted line is the lognormal distribution fitting.

