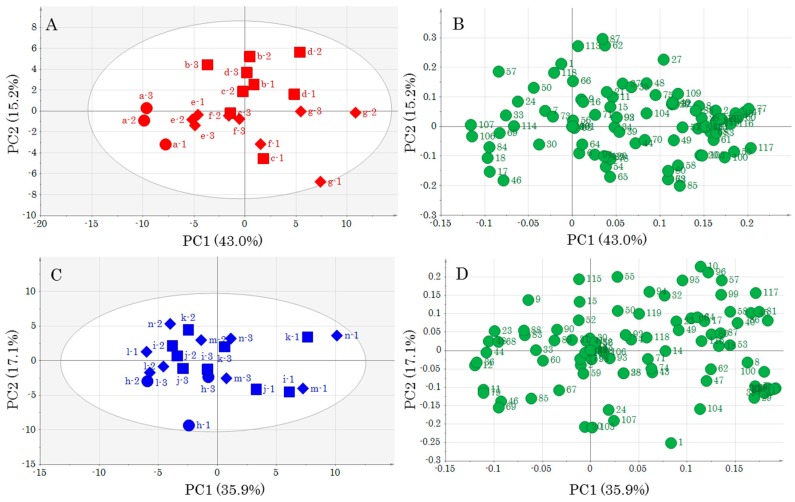
Figure 3.
Score plots and loading plots obtained by PCA of each muscle part using UV scaling. (A) Score plot for DM. ● No storage (control), ■ 0 °C storage, ◆ 5 °C storage; (B) loading plot for DM; (C) score plot for OM. ● No storage (control), ■ 0 °C storage, ◆ 5 °C storage; and (D) loading plot for OM. Lower-case letters and numbers in (A,C) indicate sample ID, and numbers in (B,D) indicate number of metabolites (Table S1).

