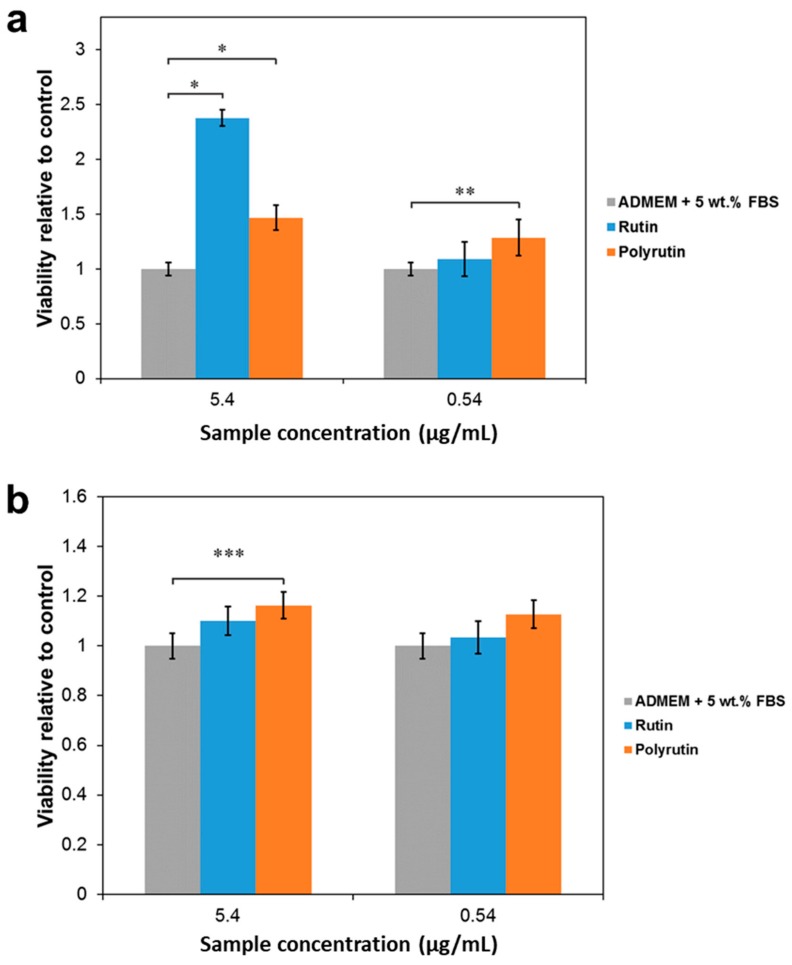
Figure 7.
Cell viability obtained from an MTT assay of (a) human skin derived fibroblasts and (b) HaCaT cells. RU and PR in the cell culture solution at concentrations of 5.4 and 0.54 µg/mL. Values are expressed as percentage of the means ± SD (n = 4). Statistical significance was defined as * p < 0.001, ** p < 0.005, *** p < 0.05 compared to the control sample (ANOVA).

