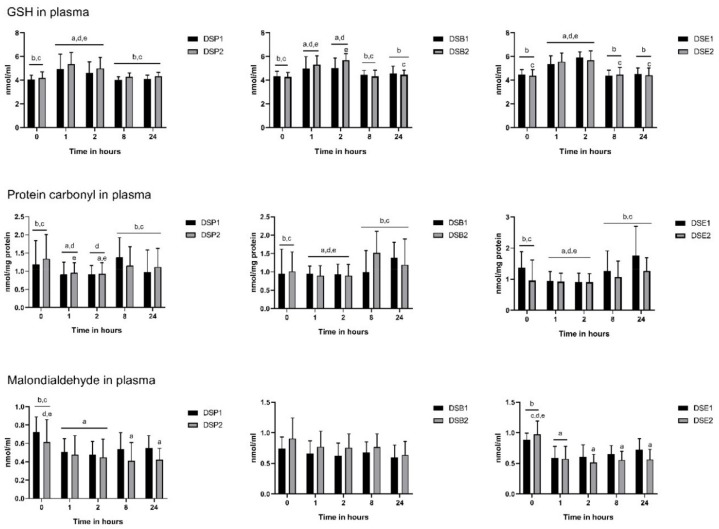
Figure 5.
Oxidative stress biomarker levels at baseline (0 h), 1, 2, 8 and 24 h after date seed treatments ingestion. Means ± SD are presented. ANOVA with repeated measures was performed. Gender and polyphenols consumption tertiles were added into the model as a between-subjects factor. Statistical significance was set at p ≤ 0.05. a Statistically significant difference with baseline; b Statistically significant difference with time point 1 h; c Statistically significant difference with time point 2 h; d Statistically significant difference with time point 8 h; e Statistically significant difference with time point 24 h.

