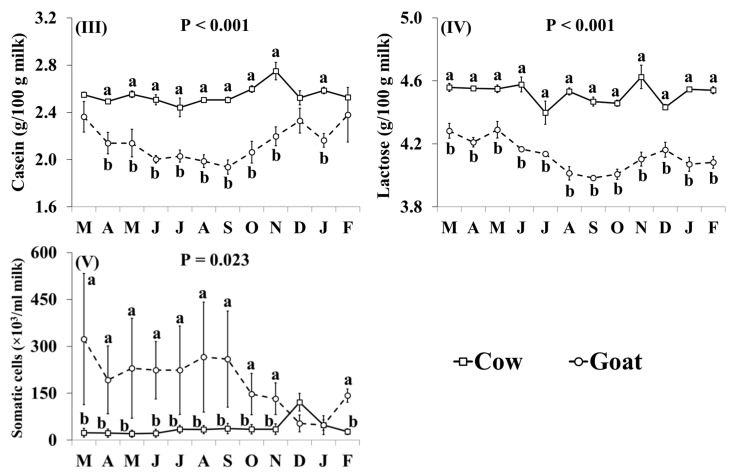
Figure 1.
Interaction means ± SE (error bars) for the effects of species (cow, goat) and month (in order of appearance from left to right in Axis X: M, March; A, April; M, May; J, June; J, July; A, August; S, September; O, October; N, November; D, December; J, January; F, February) on the basic composition of retail milk: (I) fat content; (II) protein content; (III) casein content; (IV) lactose content; (V) somatic cell count. P represents the ANOVA p-value for the interaction. Means for species and within a month with different lowercase letters are significantly different according to Fisher’s Least Significant Difference test (p < 0.05).


