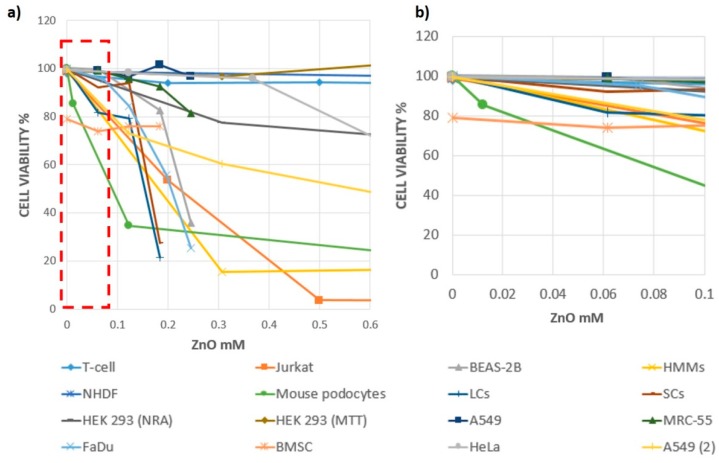
Figure 5.
(a) Overall elaboration from published data about cell viability vs. ZnO concentration, for different cell lines and different types of nanostructures; (b) zoom-in of the red dashed area in (a), highlighting the ZnO concentration range where cell viability is preserved and is relatively “safe”.

