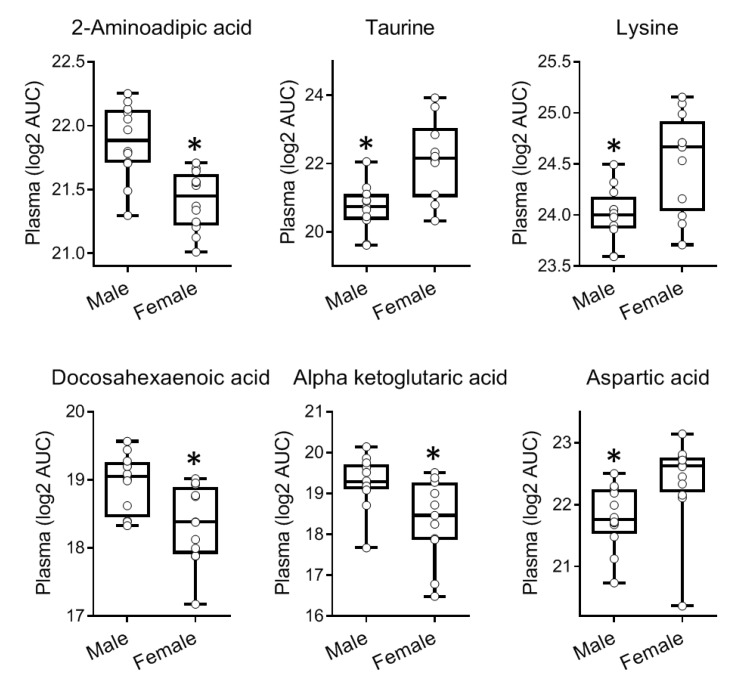
Figure 8.
Metabolites showing significant differences in plasma levels in male versus female nondiabetic C57BL/6 mice (n = 12; 6M + 6F). Data are shown as Box and Whisker plots with individual datapoints corresponding to each sample shown as round symbols. Asterisk denotes p < 0.05 by unpaired t-test.

